Exhibit 99.2
INVESTOR PRESENTATION October 202 2 Background photo shows ponchos produced by for the NYC Marathon, annually since 2013
Forward - Looking Statements and Industry Data 2 This presentation contains forward - looking statements that are based on our management’s beliefs and assumptions and on information currently available to us . All statements other than statements of historical facts are forward - looking . These statements relate to future events or to our future financial performance and involve known and unknown risks, uncertainties and other factors that may cause our actual results, levels of activity, performance or achievements to be materially different from any future results, levels of activity, performance or achievements expressed or implied by these forward - looking statements . Forward - looking statements include, but are not limited to, statements about : • our goals and strategies; • our future business development, financial condition and results of operations; • expected changes in our revenue, costs or expenditures; • growth of and competition trends in our industry; • our expectations regarding demand for, and market acceptance of, our products; • our expectations regarding our relationships with investors, institutional funding partners and other parties we collaborate with; • our expectation regarding the use of proceeds from the offering; • fluctuations in general economic and business conditions in the markets in which we operate; • relevant government policies and regulations relating to our industry; • key personnel continuing their employment with us; and • the duration and impact of the COVID - 19 pandemic. In some cases, you can identify forward - looking statements by terms such as “may,” “could,” “will,” “should,” “would,” “expect,” “plan,” “intend,” “anticipate,” “believe,” “estimate,” “predict,” “potential,” “project” or “continue” or the negative of these terms or other comparable terminology . These statements are only predictions . You should not place undue reliance on forward - looking statements because they involve known and unknown risks, uncertainties and other factors, which are, in some cases, beyond our control and which could materially affect results . Factors that may cause actual results to differ materially from current expectations include, among other things, those listed under the heading “Risk Factors” and elsewhere in the registration statement that we have filed with the SEC . If one or more of these risks or uncertainties occur, or if our underlying assumptions prove to be incorrect, actual events or results may vary significantly from those implied or projected by the forward - looking statements . No forward - looking statement is a guarantee of future performance . In addition, statements that “we believe” and similar statements reflect our beliefs and opinions on the relevant subject . These statements are based upon information available to us as of the date on which the statements are made in this presentation, and while we believe such information forms a reasonable basis for such statements, such information may be limited or incomplete, and our statements should not be read to indicate that we have conducted an exhaustive inquiry into, or review of, all potentially available relevant information . These statements are inherently uncertain and investors are cautioned not to unduly rely upon these statements . The forward - looking statements made in this presentation relate only to events or information as of the date on which the statements are made in this presentation . Although we have ongoing disclosure obligations under United States federal securities laws, we do not intend to update or otherwise revise the forward - looking statements in this presentation, whether as a result of new information, future events or otherwise . Market & Industry Data This presentation also contains estimates and other statistical data made by independent parties and by us relating to market - size and other data about our industry . This data involves a number of assumptions and limitations, and you are cautioned not to give undue weight to such data and estimates . In addition, projections, assumptions and estimates of our future performance and the future performance of the markets in which we operate are necessarily subject to a high degree of uncertainty and risk . Neither we nor our affiliates, advisors or representatives makes any representation as to the accuracy or completeness of that data or undertake to update such data after the date of this presentation .
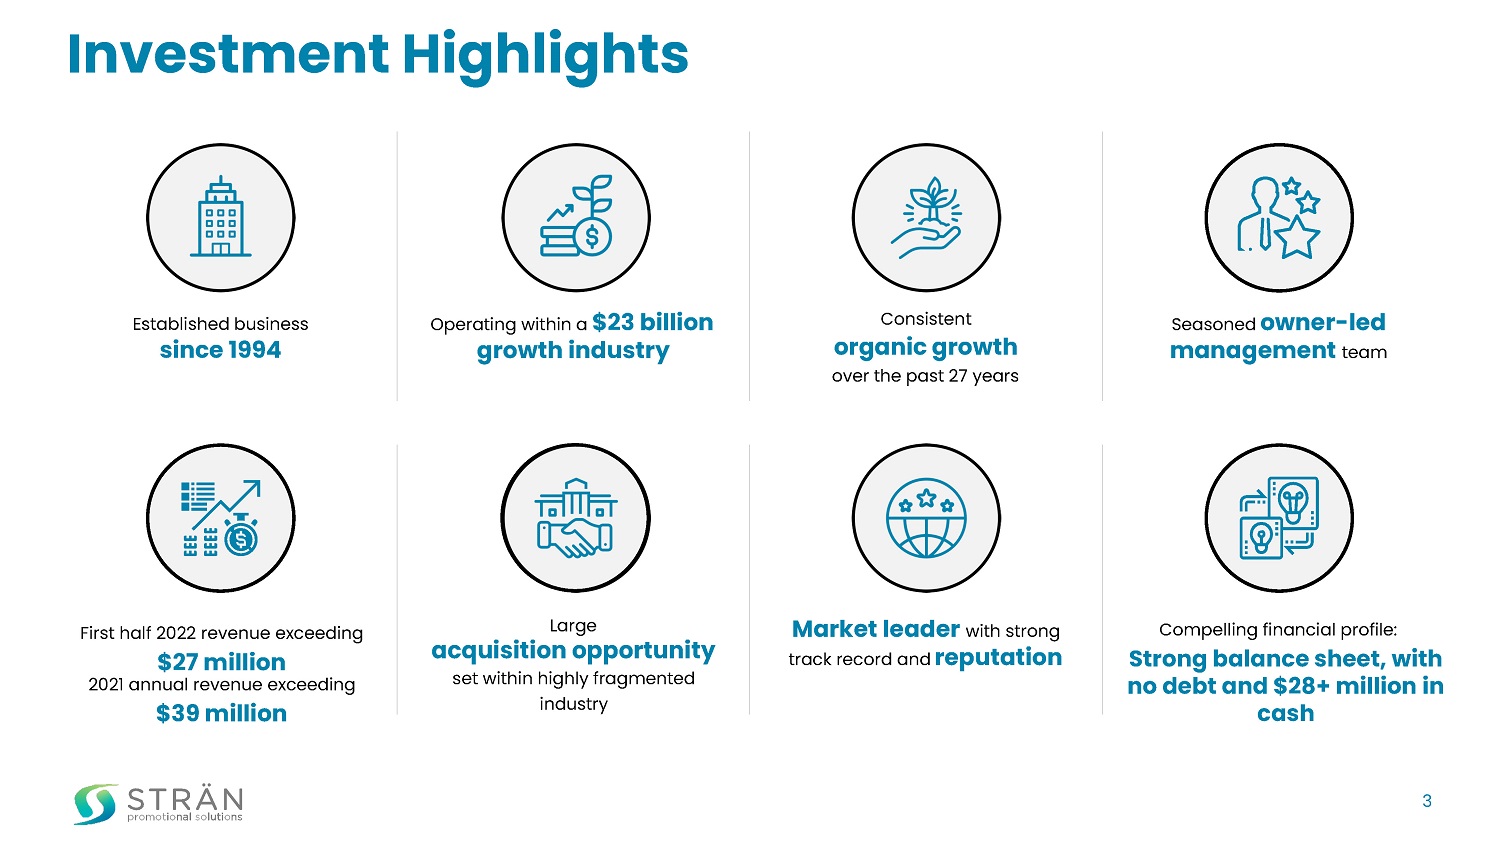
3 Investment Highlights Established business since 1994 202 1 a nnual revenue exceeding $3 9 million Large acquisition opportunity set within highly fragmented industry Consistent organic growth over the past 27 years Seasoned owner - led management team Compelling financial profile: Market leader with strong track record and reputation Operating within a $2 3 billion growth industry Strong balance sheet, with no debt and $28+ million in cash First half 202 2 revenue exceeding $ 27 million
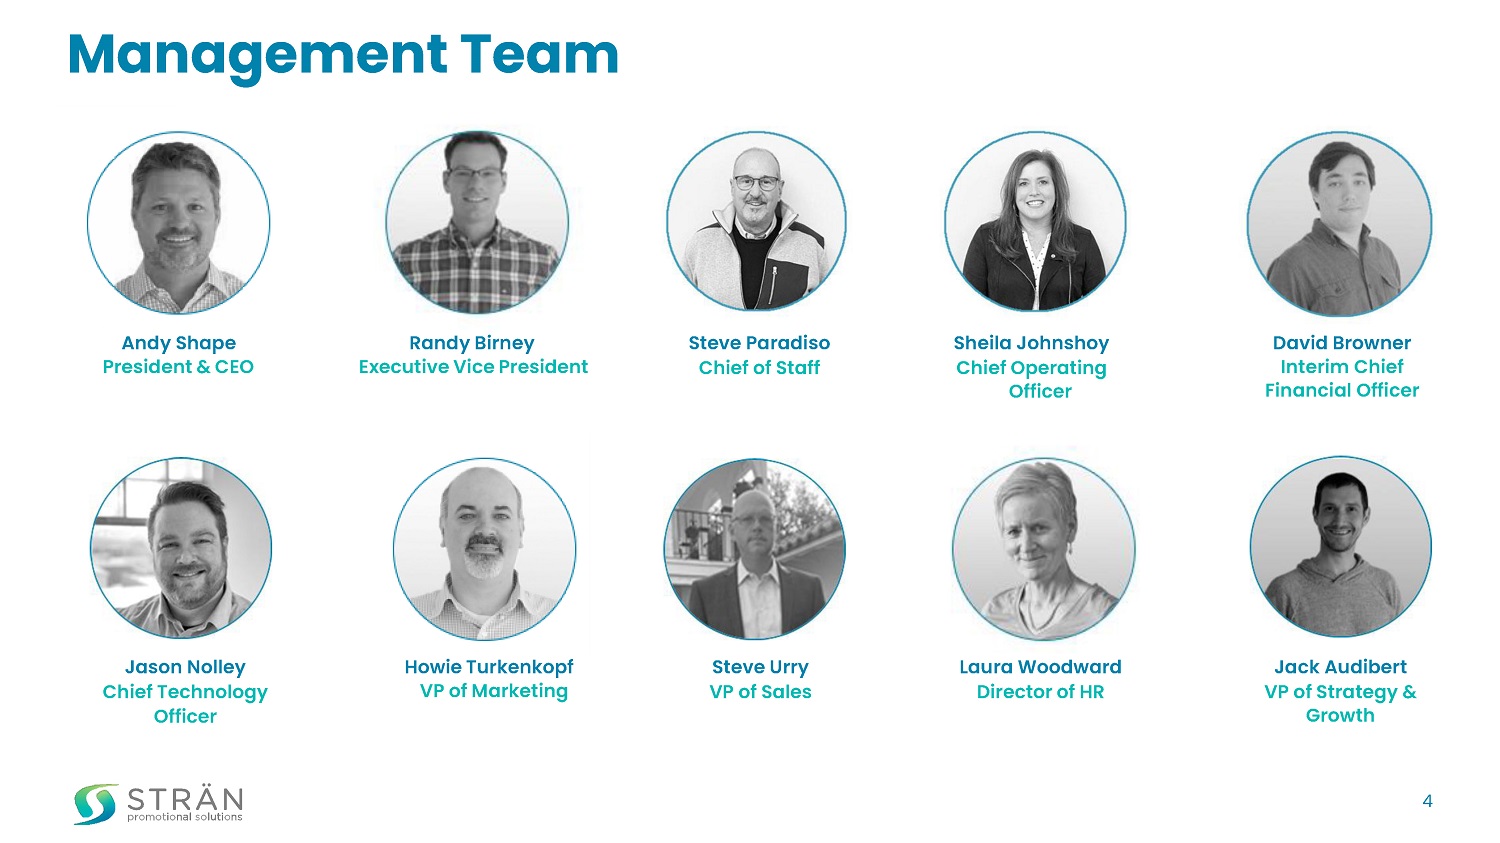
Management Team Laura Woodward Director of HR Sheila Johnshoy Chief Operating Officer Andy Shape President & CEO Randy Birney Executive Vice President David Browner Interim Chief Financial Officer Steve Paradiso Chief of Staff Steve Urry VP of Sales Jack Audibert VP of Strategy & Growth Howie Turkenkopf VP of Marketing Jason Nolley Chief Technology Officer 4
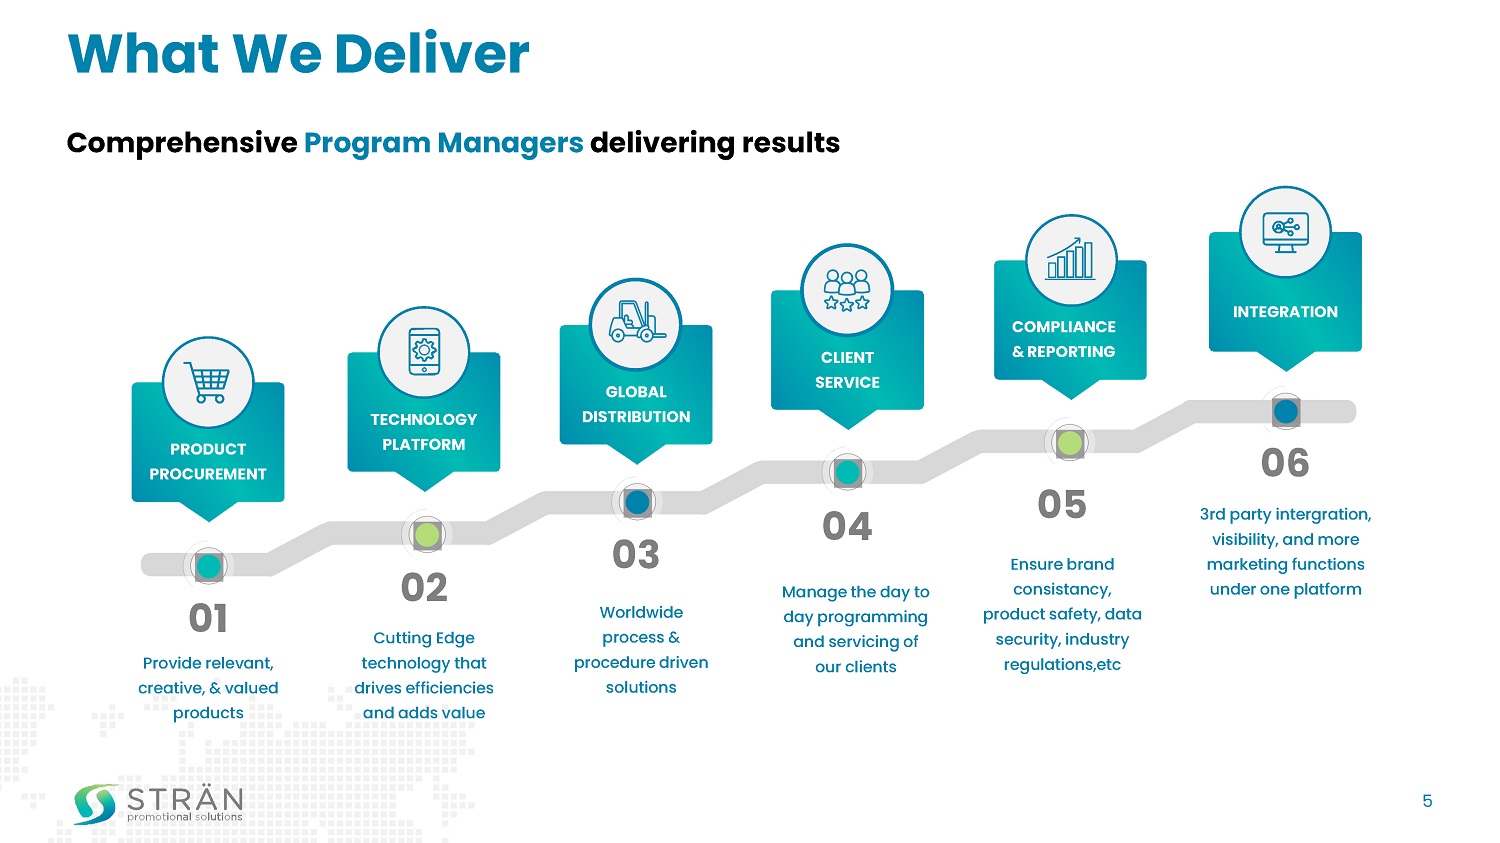
What We Deliver Comprehensive Program Managers delivering results 01 Provide relevant, creative, & valued products 02 Cutting Edge technology that drives efficiencies and adds value 03 Worldwide process & procedure driven solutions 04 Manage the day to day programming and servicing of our clients 05 Ensure brand consistancy, product safety, data security, industry regulations,etc 06 3rd party intergration, visibility, and more marketing functions under one platform TECHNOLOGY PLATFORM PRODUCT PROCUREMENT GLOBAL DISTRIBUTION CLIENT SERVICE COMPLIANCE & REPORTING INTEGRATION 5
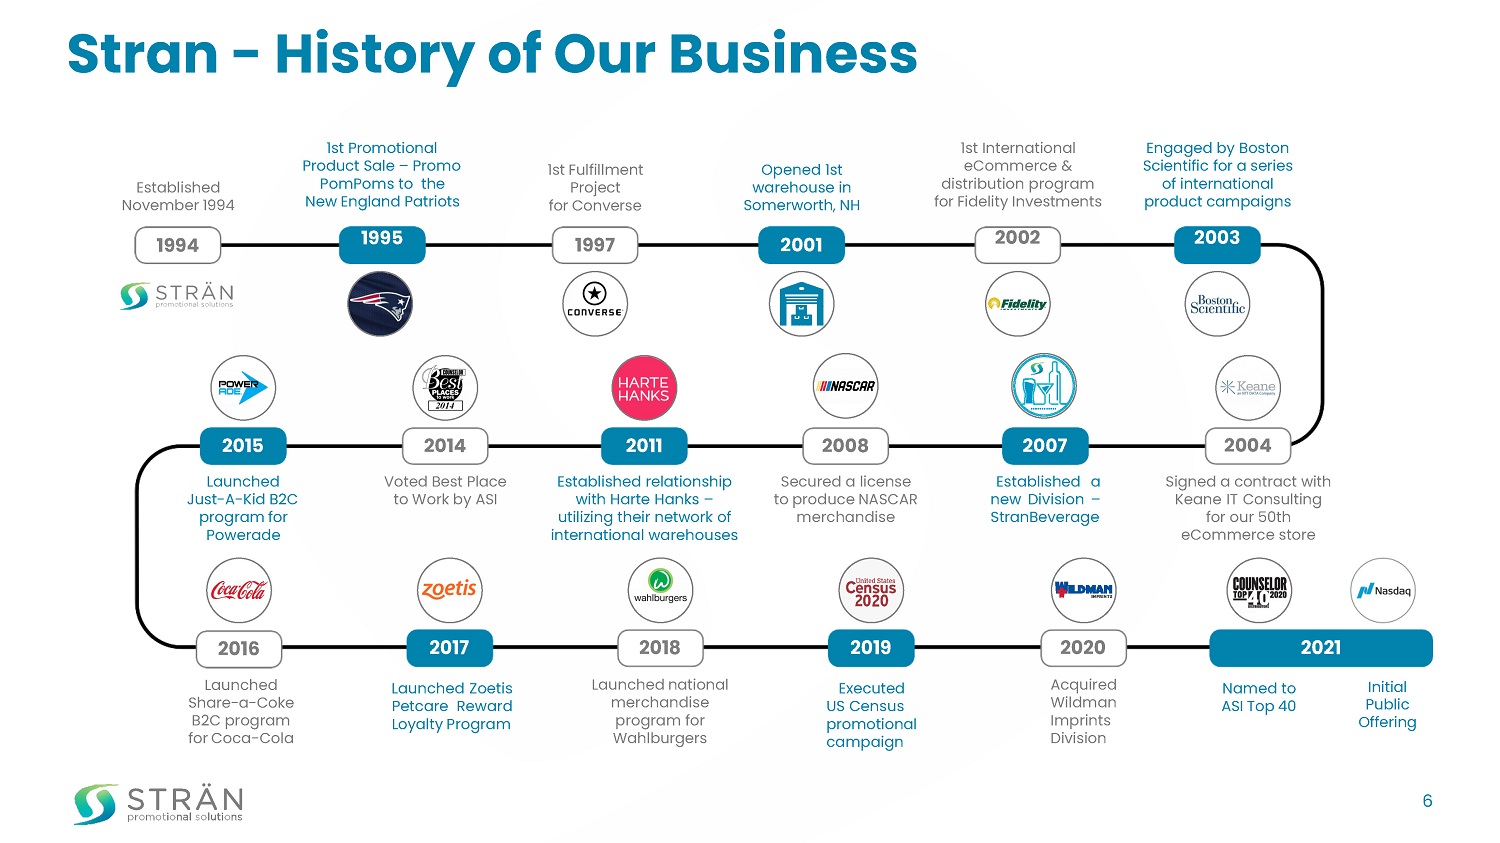
Stran - History of Our Business 2021 Established November 1994 1994 1st Promotional Product Sale – Promo PomPoms to the New England Patriots 1995 2007 Established a new Division – StranBeverage 2008 Secured a license to produce NASCAR merchandise 2014 Voted Best Place to Work by ASI 2016 Launched Share - a - Coke B2C program for Coca - Cola 2018 Launched national merchandise program for Wahlburgers 2020 Acquired Wildman Imprints Division 2011 Established relationship with Harte Hanks – utilizing their network of international warehouses 2017 Launched Zoetis Petcare Reward Loyalty Program 2019 Executed US Census promotional campaign Named to ASI Top 40 Opened 1st warehouse in Somerworth, NH 2001 1st International eCommerce & distribution program for Fidelity Investments 2002 Engaged by Boston Scientific for a series of international product campaigns 2003 2004 Signed a contract with Keane IT Consulting for our 50th eCommerce store 1st Fulfillment Project for Converse 1997 2015 Launched Just - A - Kid B2C program for Powerade 6 Initial Public Offering
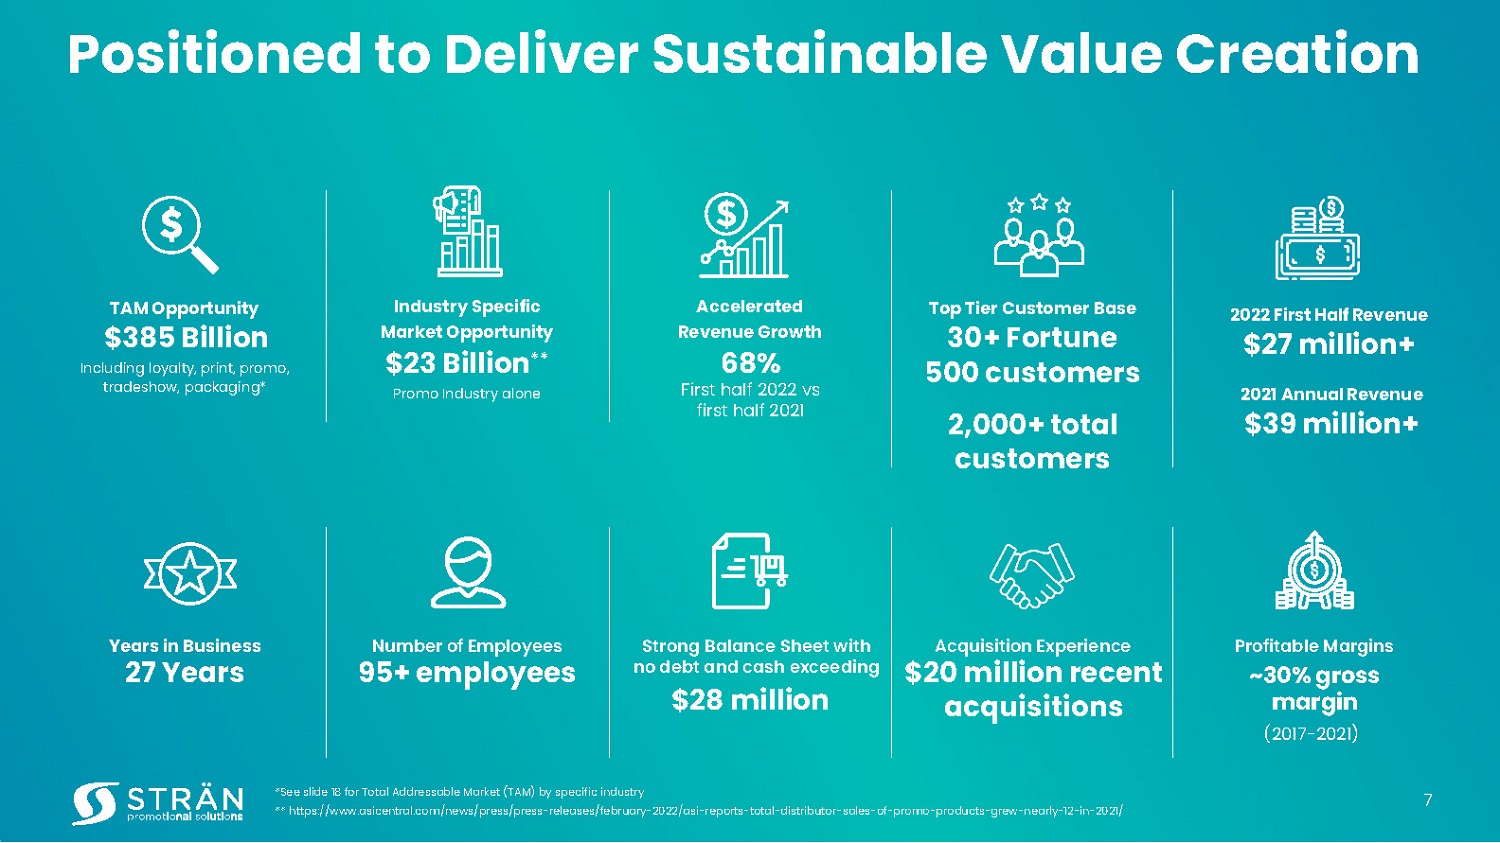
7 Positioned to Deliver Sustainable Value Creation TAM Opportunity $38 5 Billion Including loyalty, print, promo, tradeshow, packaging* Industry Specific Market Opportunity $2 3 Billion ** Promo Industry alone Accelerated Revenue Growth 68 % First half 2022 vs first half 2021 Top Tier Customer Base 30+ Fortune 500 customers 2,000+ total customers 202 1 Annual Revenue $3 9 million+ Profitable Margins ~ 30% gross margin (2017 - 202 1 ) Years in Business 27 Years Number of Employees 95 + employees Strong Balance Sheet with no debt and cash exceeding $28 million Acquisition Experience $ 20 million recent acquisitions *See slide 1 8 for Total Addressable Market (TAM) by specific industry ** https://www.asicentral.com/news/press/press - releases/february - 2022/asi - reports - total - distributor - sales - of - promo - products - grew - ne arly - 12 - in - 2021/ 202 2 First Half Revenue $ 27 million+
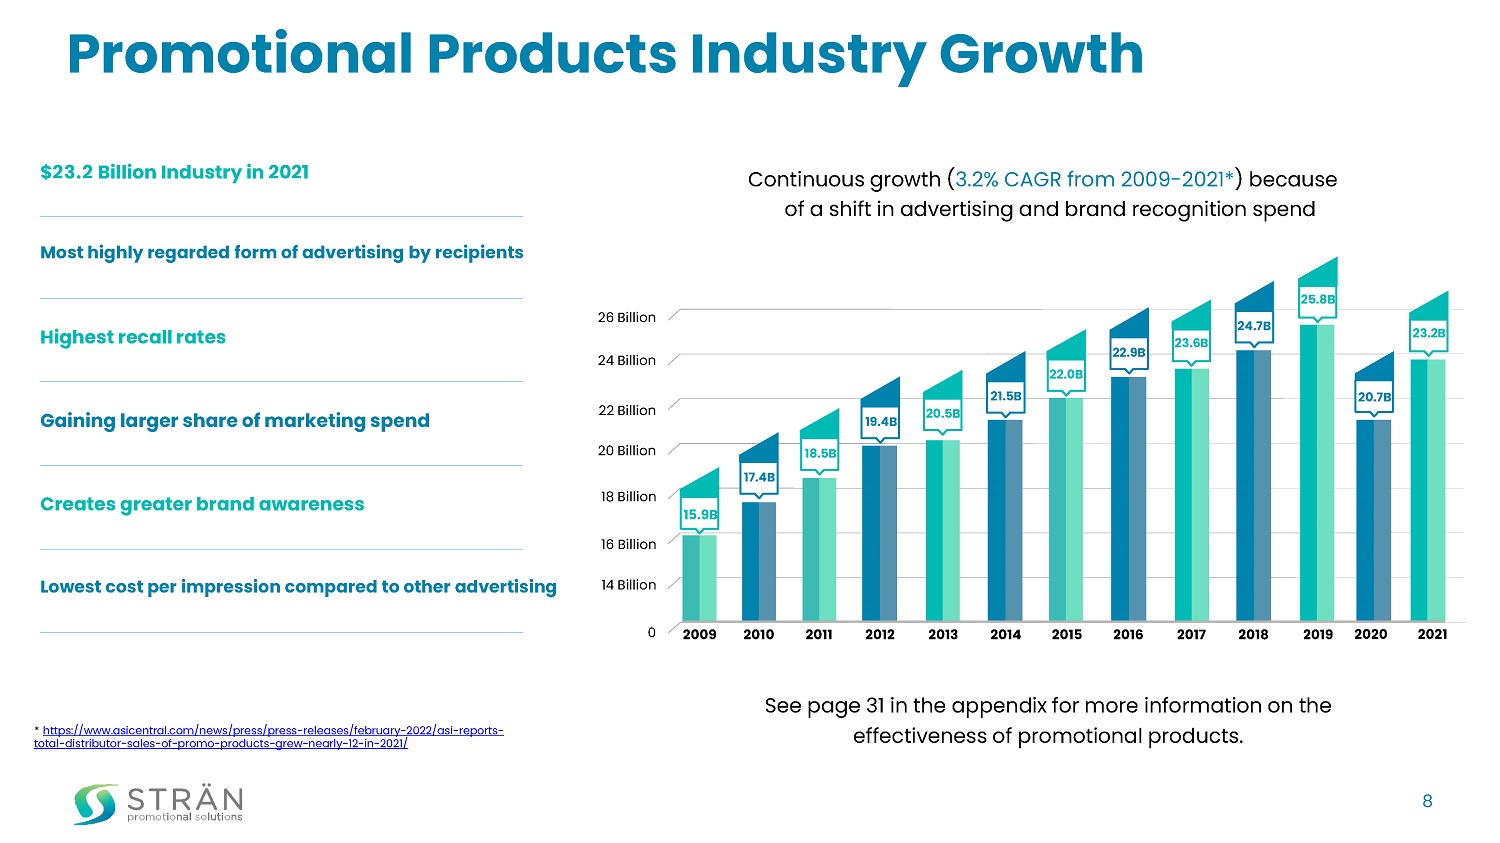
Promotional Products Industry Growth Continuous growth ( 3 . 2 % CAGR from 2009 - 20 21 * ) because of a shift in advertising and brand recognition spend See page 31 in the appendix for more information on the effectiveness of promotional products. Most highly regarded form of advertising by recipients Highest recall rates Gaining larger share of marketing spend Creates greater brand awareness Lowest cost per impression compared to other advertising * https://www.asicentral.com/news/press/press - releases/february - 2022/asi - reports - total - distributor - sales - of - promo - products - grew - nearly - 12 - in - 2021 / 0 2009 2010 2011 2012 2013 2014 2015 2016 2017 2018 2019 23.6B 22.0B 20.5B 18.5B 22.9B 19.4B 17.4B 24.7B 21.5B 16 Billion 14 Billion 18 Billion 20 Billion 22 Billion 24 Billion 26 Billion 25.8B 8 20 20 20 21 2 3.2 B 15.9B 2 0.7 B $ 23.2 Billion Industry in 2021
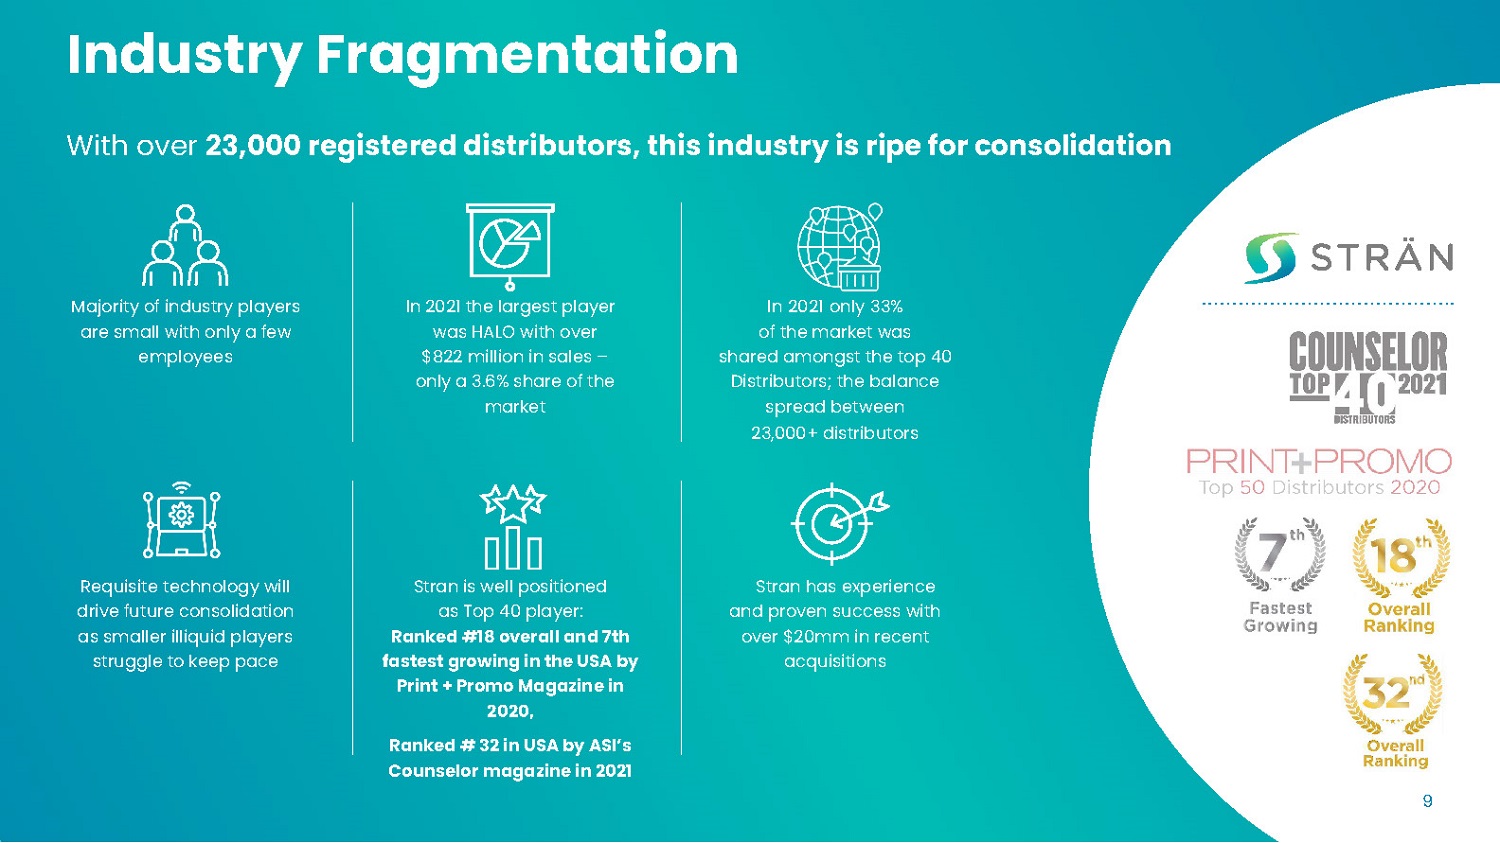
Industry Fragmentation With over 23,000 registered distributors, this industry is ripe for consolidation Majority of industry players are small with only a few employees Requisite technology will drive future consolidation as smaller illiquid players struggle to keep pace In 20 21 the largest player was HALO with over $ 822 m illion in sales – only a 3. 6 % share of the market Stran is well positioned as Top 40 player: Ranked #18 overall and 7th fastest growing in the USA by Print + Promo Magazine in 2020 , Ranked # 32 in USA by ASI’ s Counselor magazine in 2021 In 20 21 only 33 % of the market was shared amongst the top 4 0 Distributors; the balance spread between 23,000+ distributors Stran has experience and proven success with over $ 20 mm in recent acquisition s 9
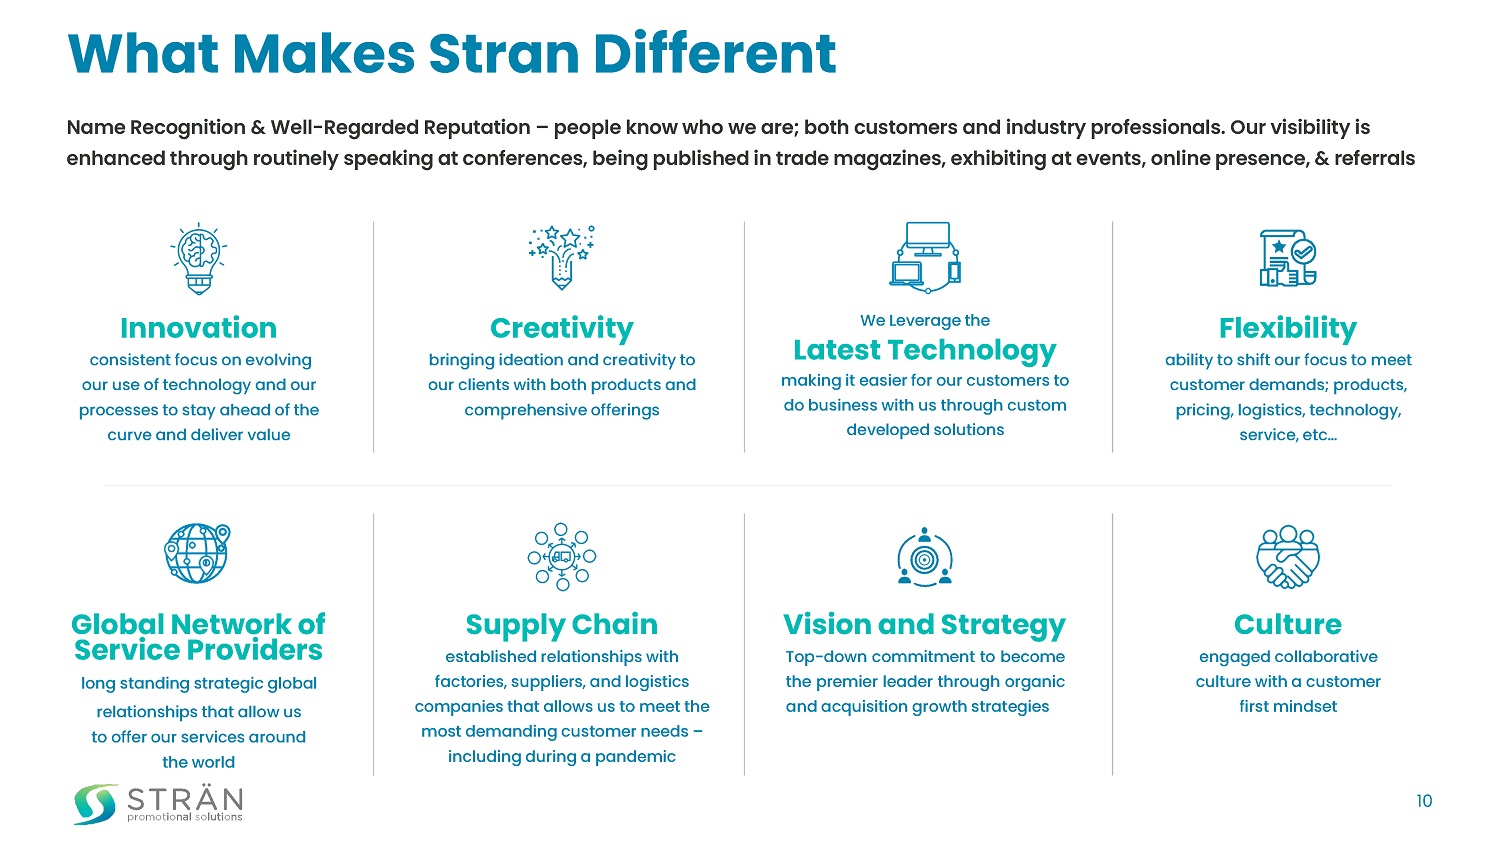
What Makes Stran Different Name Recognition & Well - Regarded Reputation – people know who we are; both customers and industry professionals. Our visibility is enhanced through routinely speaking at conferences, being published in trade magazines, exhibiting at events, online presence, & referrals We Leverage the Latest Technology making it easier for our customers to do business with us through custom developed solutions Vision and Strategy Top - down commitment to become the premier leader through organic and acquisition growth strategies Creativity bringing ideation and creativity to our clients with both products and comprehensive offerings Supply Chain established relationships with factories, suppliers, and logistics companies that allows us to meet the most demanding customer needs – including during a pandemic Flexibility ability to shift our focus to meet customer demands; products, pricing, logistics, technology, service, etc… Culture engaged collaborative culture with a customer first mindset Global Network of Service Providers long standing strategic global relationships that allow us to offer our services around the world Innovation consistent focus on evolving our use of technology and our processes to stay ahead of the curve and deliver value 10
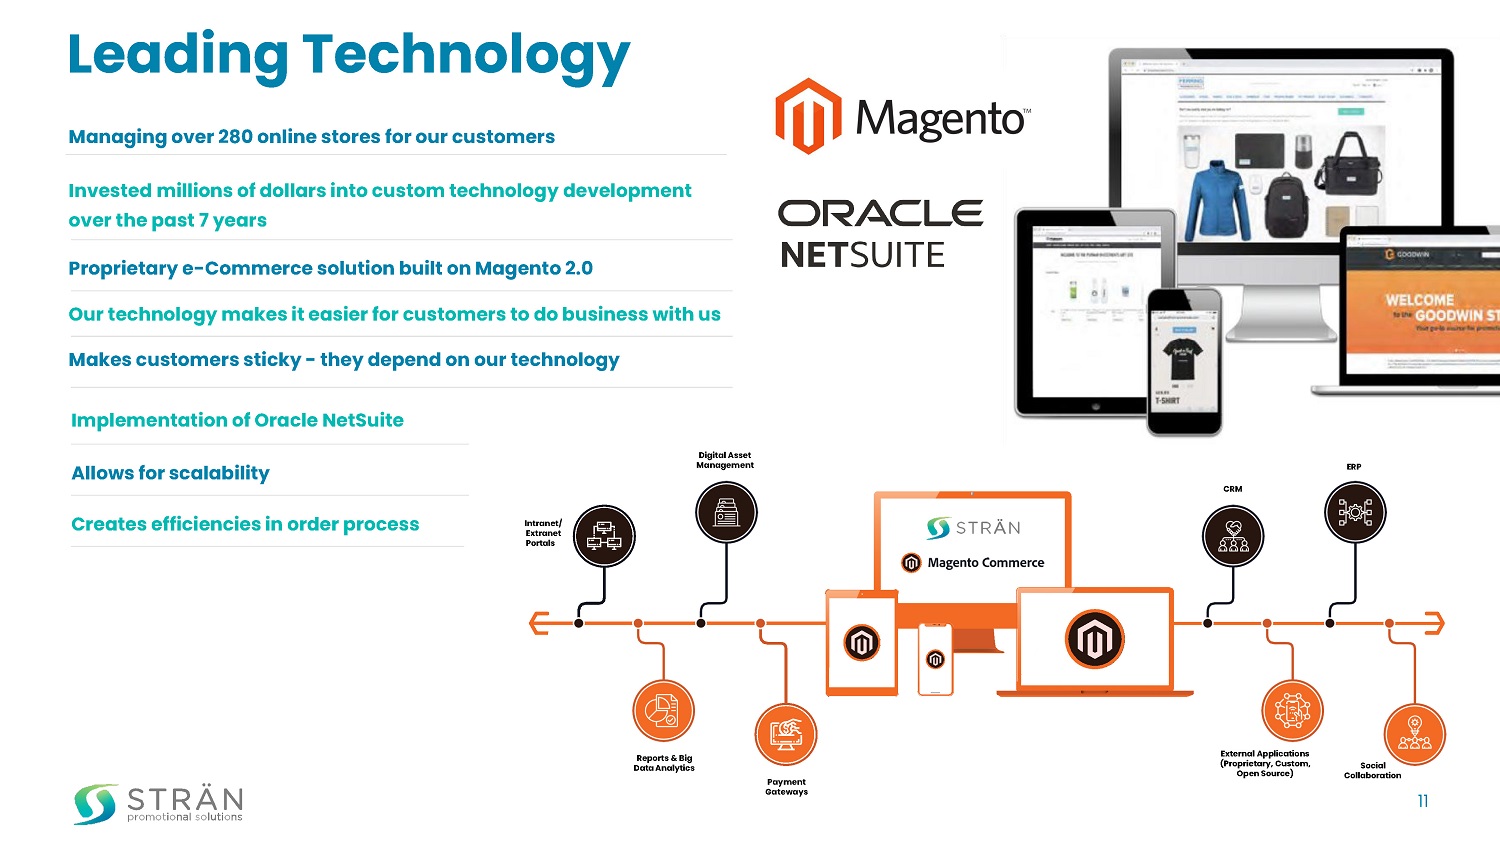
11 Leading Technology Managing over 280 online stores for our customers Invested millions of dollars into custom technology development over the past 7 years Proprietary e - Commerce solution built on Magento 2.0 Our technology makes it easier for customers to do business with us Makes customers sticky - they depend on our technology Implementation of Oracle NetSuite Allows for scalability Creates efficiencies in order process Intranet/ Extranet Portals Digital Asset Management Payment Gateways Reports & Big Data Analytics CRM ERP Social Collaboration External Applications (Proprietary, Custom, Open Source)
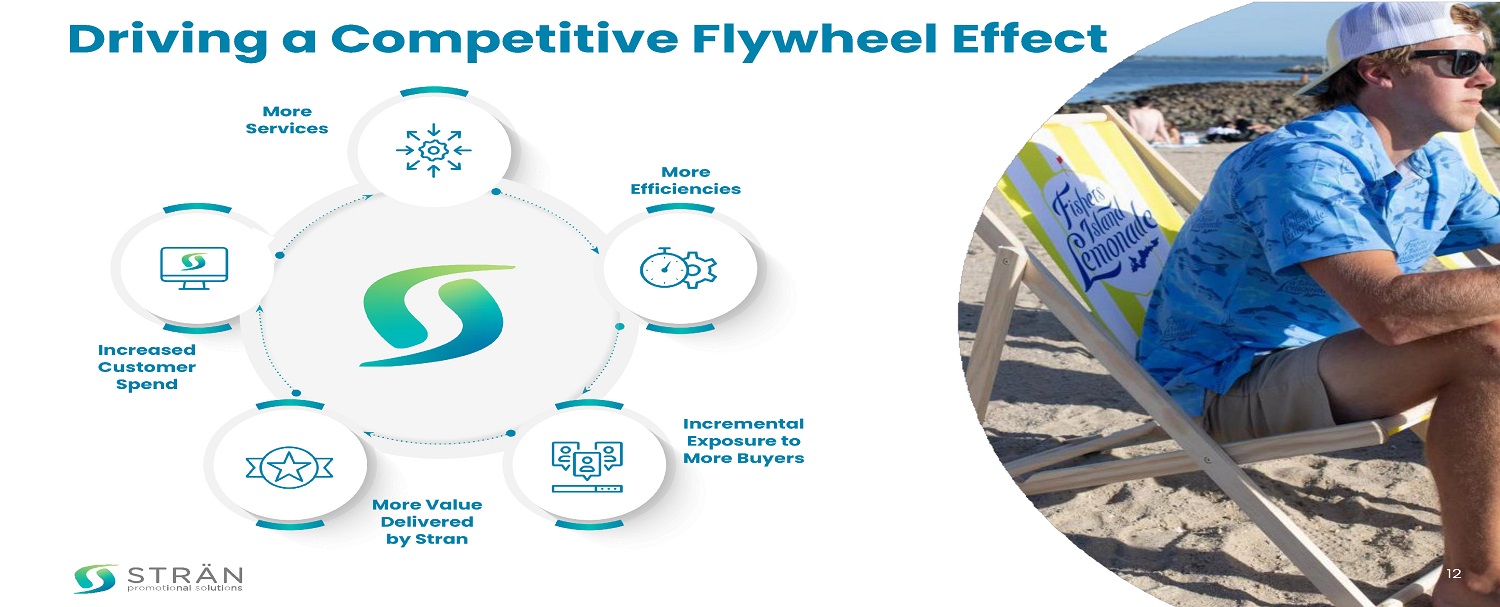
Driving a Competitive Flywheel Effect 12
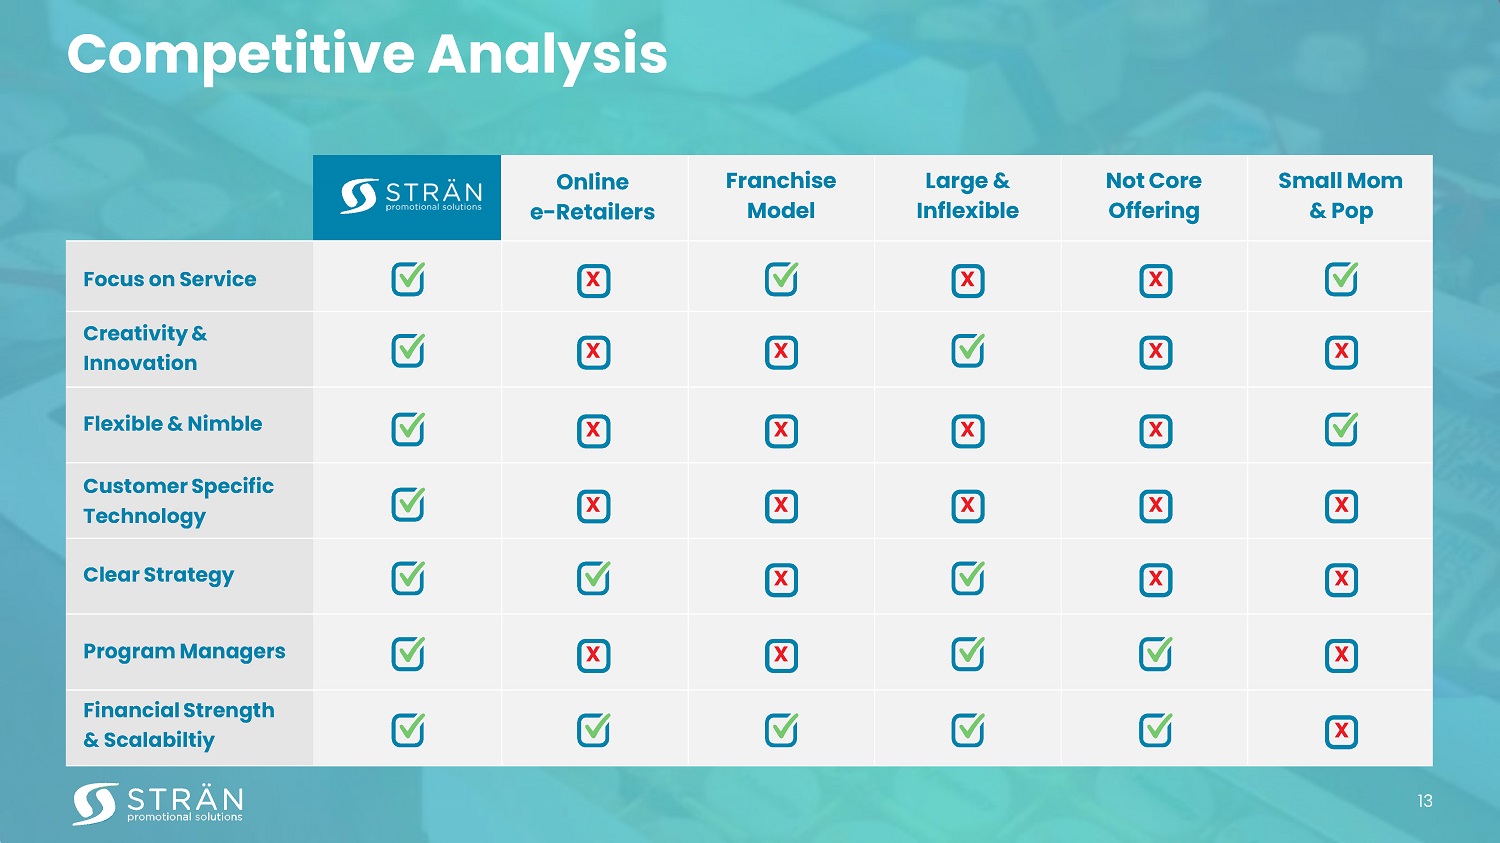
Competitive Analysis Online e - Retailers Franchise Model Large & Inflexible Not Core Offering Small Mom & Pop Focus on Service x x x Creativity & Innovation x x x x Flexible & Nimble x x x x Customer Specific Technology x x x x x Clear Strategy x x x Program Managers x x x Financial Strength & Scalabiltiy x 13
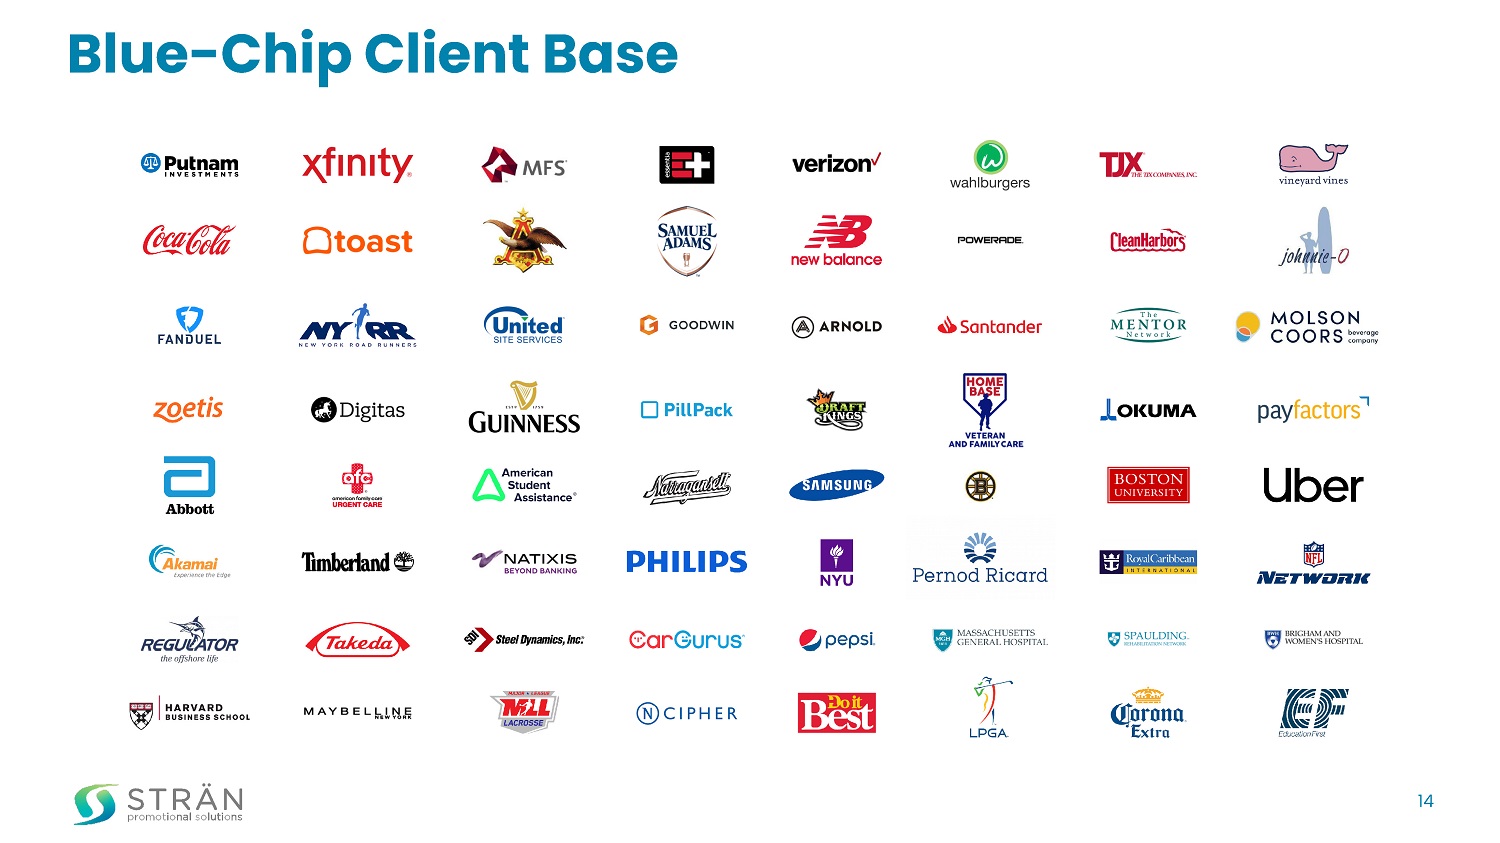
Blue - Chip Client Base 14
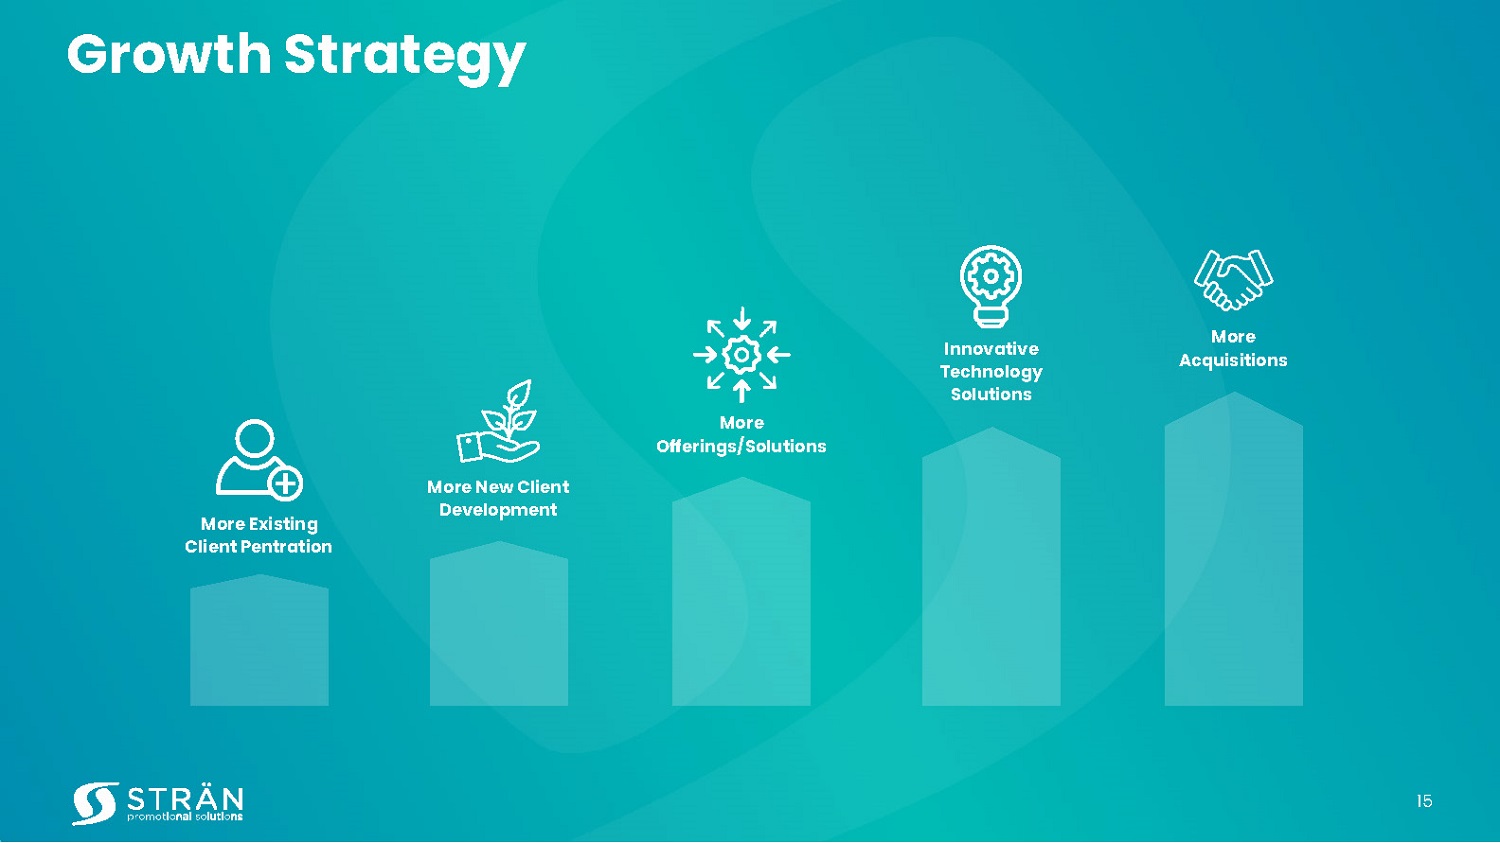
More Existing Client Pentration More New Client Development More Offerings/Solutions Innovative Technology Solutions More Acquisitions Growth Strategy 15
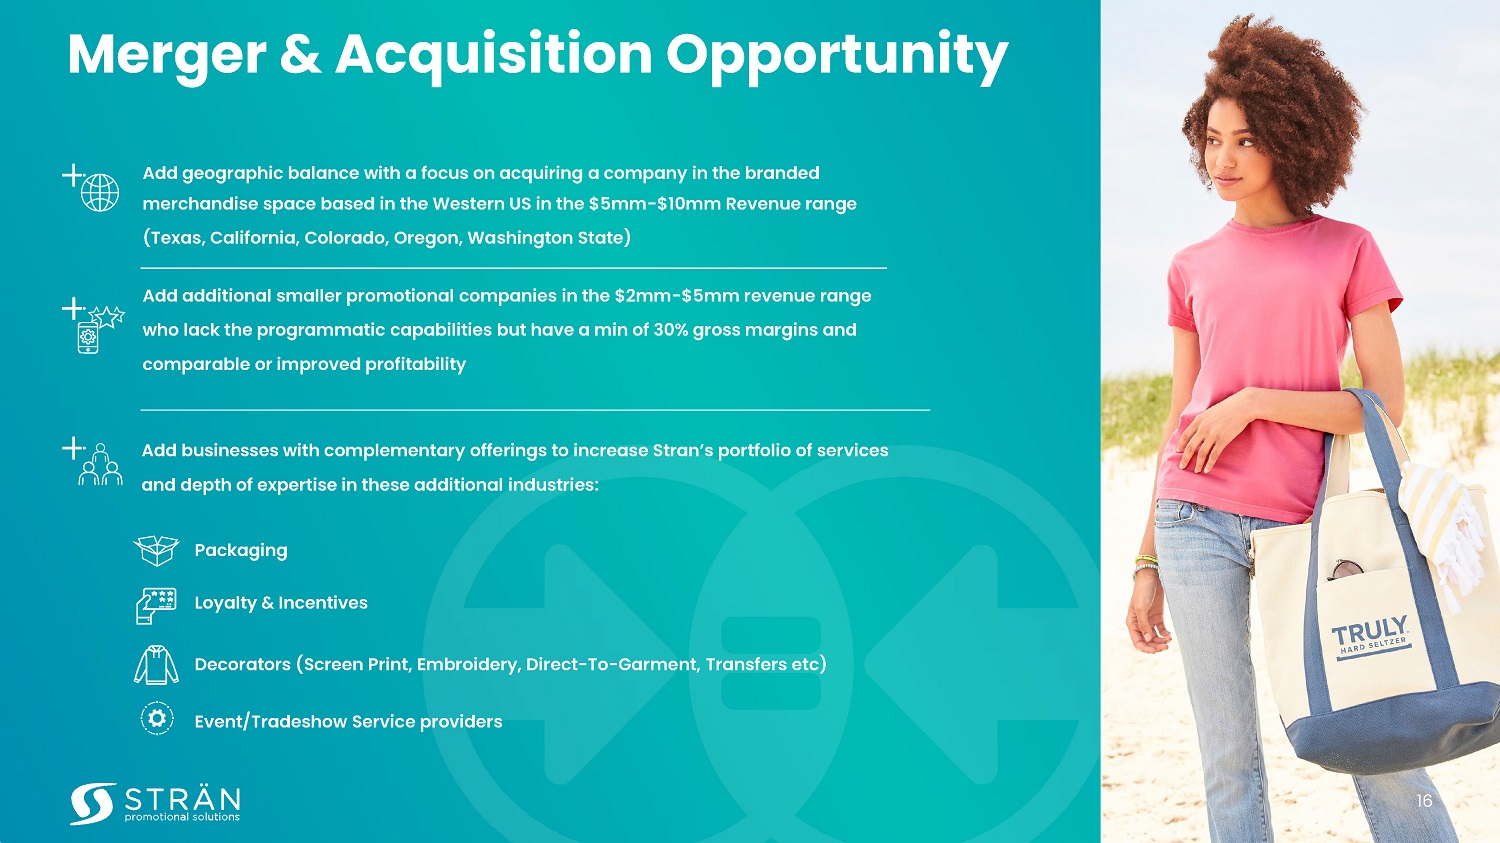
Merger & Acquisition Opportunity Add geographic balance with a focus on acquiring a company in the branded merchandise space based in the Western US in the $5mm - $10mm Revenue range (Texas, California, Colorado, Oregon, Washington State) Add additional smaller promotional companies in the $2mm - $5mm revenue range who lack the programmatic capabilities but have a min of 30% gross margins and comparable or improved profitability Add businesses with complementary offerings to increase Stran’s portfolio of services and depth of expertise in these additional industries: Packaging Loyalty & Incentives Decorators (Screen Print, Embroidery, Direct - To - Garment, Transfers etc ) Event/Tradeshow Service providers 16
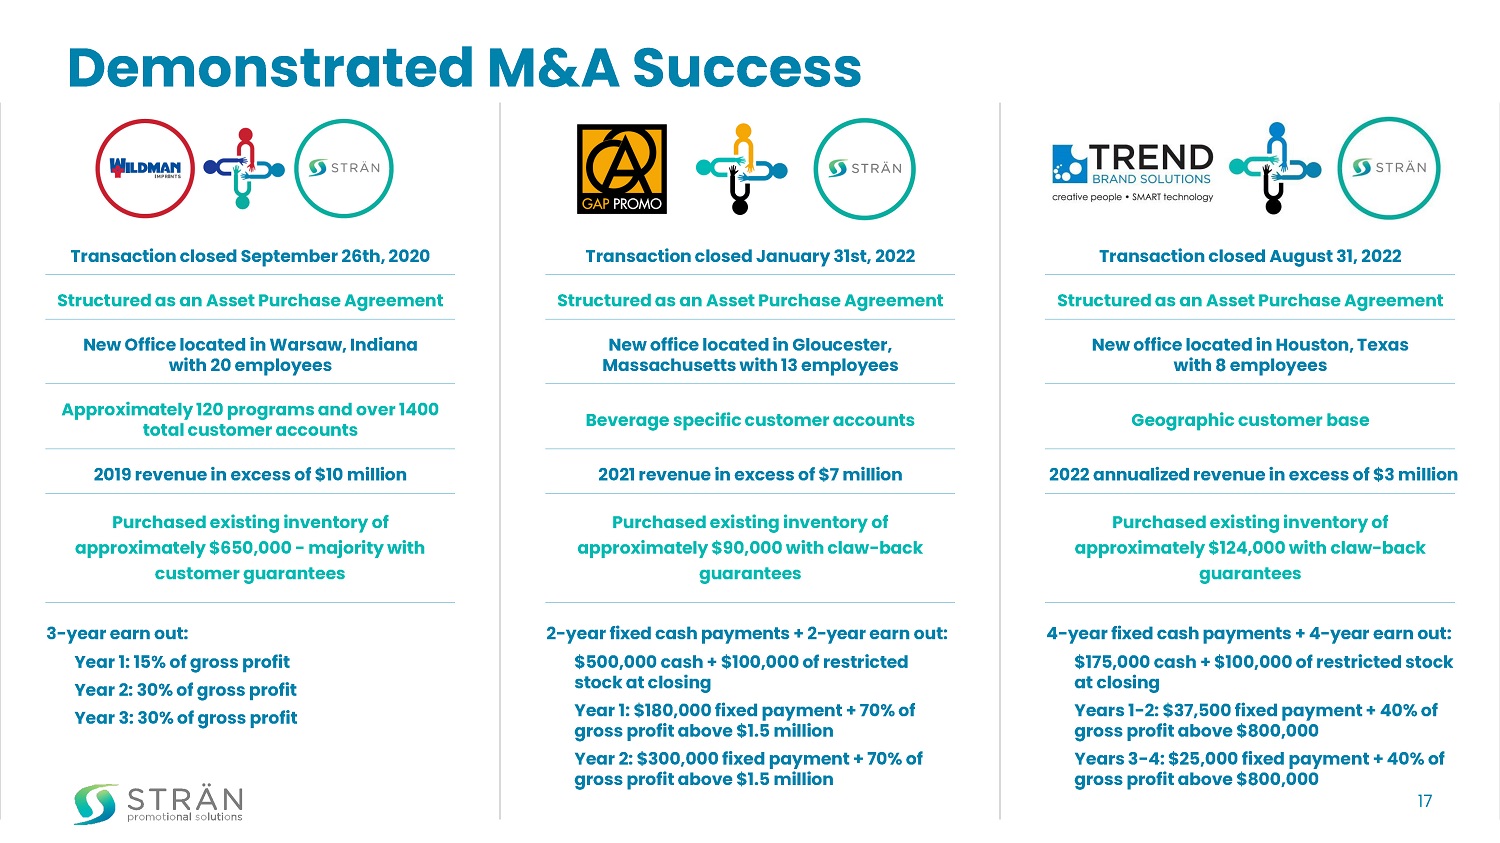
Wildman Sales 10 Million Demonstrated M&A Success Transaction closed September 26th, 2020 Structured as an Asset Purchase Agreement New Office located in Warsaw, Indiana with 20 employees 2019 revenue in excess of $10 million Purchased existing inventory of approximately $650,000 - majority with customer guarantees 3 - year earn out : Year 1 : 15% of gross profit Year 2 : 30% of gross profit Year 3: 30% of gross profit Approximately 120 programs and over 1400 total customer accounts Transaction closed January 31st, 202 2 New o ffice located in Gloucester, Massachusetts with 13 employees 20 21 revenue in excess of $ 7 million Purchased existing inventory of approximately $ 90 ,000 with claw - back guarantees 2 - year fixed cash payments + 2 - year earn out : $500,000 cash + $100,000 of restricted stock at closing Year 1 : $180,000 fixed payment + 70% of gross profit above $1.5 million Year 2: $300,000 fixed payment + 70% of gross profit above $1.5 million Beverage specific cu stomer accounts Transaction closed August 31, 202 2 Wildman Sales 10 Million New o ffice located in Houston, Texas with 8 employees 20 22 annualized revenue in excess of $ 3 million Purchased existing inventory of approximately $ 124 ,000 with claw - back guarantees 4 - year fixed cash payments + 4 - year earn out : $175,000 cash + $100,000 of restricted stock at closing Year s 1 - 2: $37,500 fixed payment + 40% of gross profit above $800,000 Year s 3 - 4: $25,000 fixed payment + 40% of gross profit above $800,000 Geographic cu stomer base Structured as an Asset Purchase Agreement Structured as an Asset Purchase Agreement 17
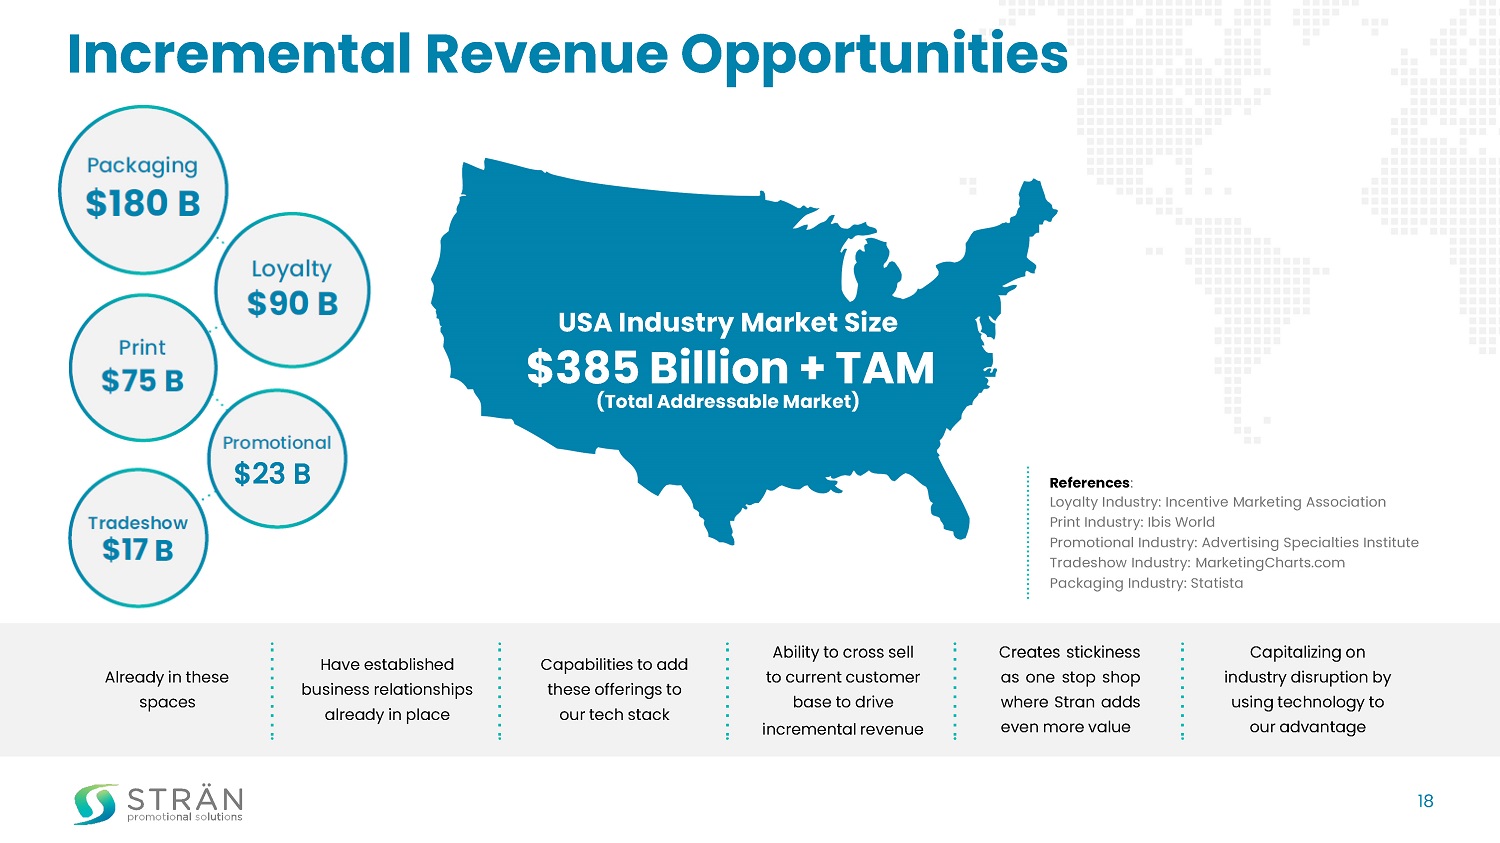
Incremental Revenue Opportunities Already in these spaces Capabilities to add these offerings to our tech stack Creates stickiness as one stop shop where Stran adds even more value Have established business relationships already in place Ability to cross sell to current customer base to drive incremental revenue Capitalizing on industry disruption by using technology to our advantage References : Loyalty Industry: Incentive Marketing Association Print Industry: Ibis World Promotional Industry: Advertising Specialties Institute Tradeshow Industry: MarketingCharts.com Packaging Industry: Statista USA Industry Market Size $38 5 Billion + TAM (Total Addressable Market) Packaging $180 B Loyalty $90 B Print $75 B Promotional $25 B Tradeshow $17 B 18 $23 B
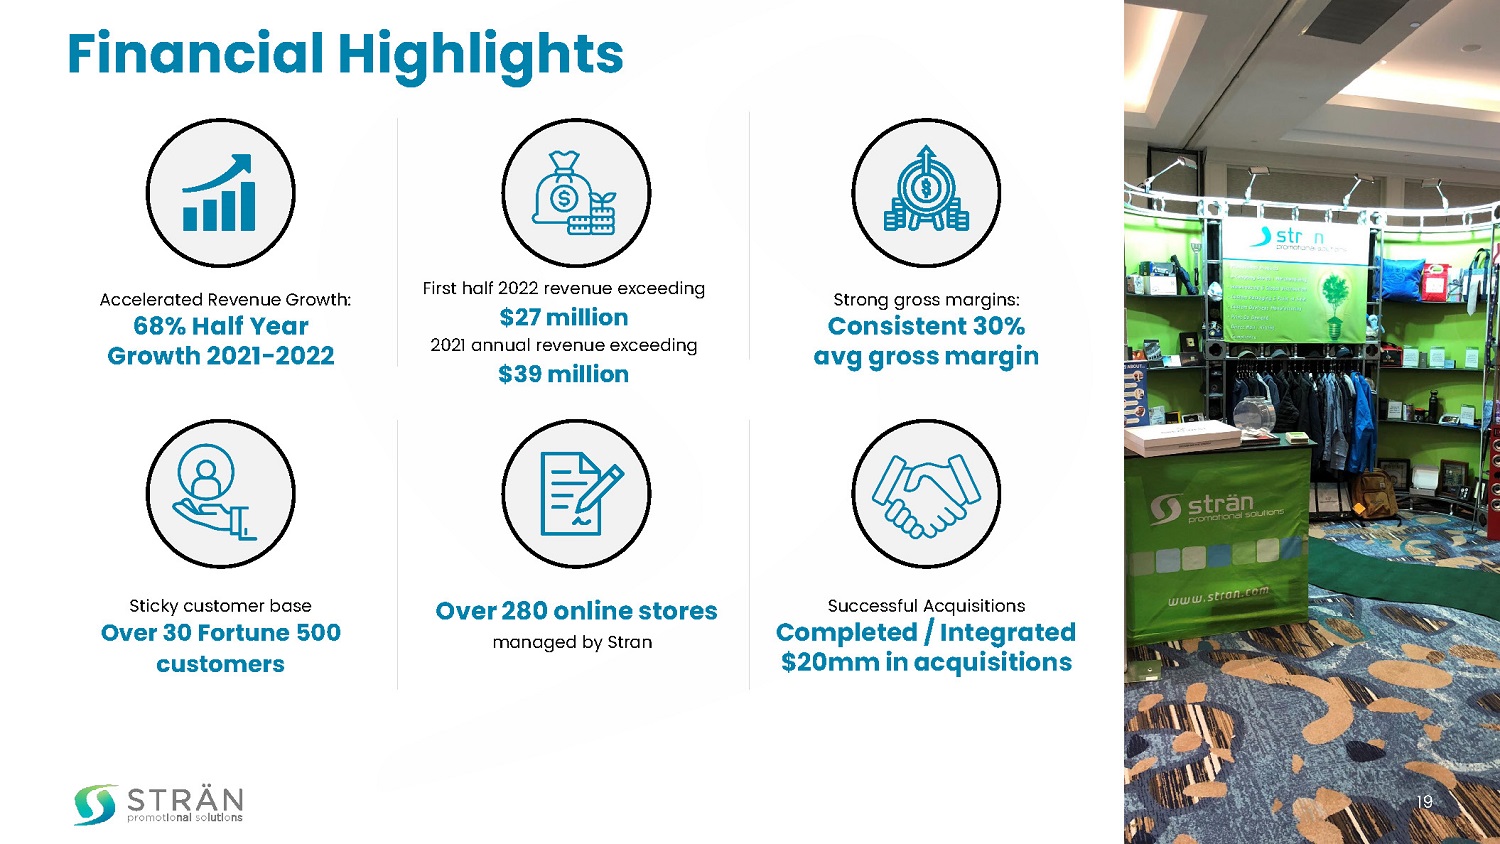
Financial Highlights Accelerated Revenue Growth : 68% Half Year Growth 2021 - 2022 Strong gross margins: Consistent 30% avg gross margin Sticky customer base Over 30 Fortune 500 customers Over 280 online stores managed by Stran Successful Acquisition s Completed / Integrated $ 20 mm in acquisition s 19 202 1 a nnual revenue exceeding $3 9 million First half 202 2 revenue exceeding $ 27 million
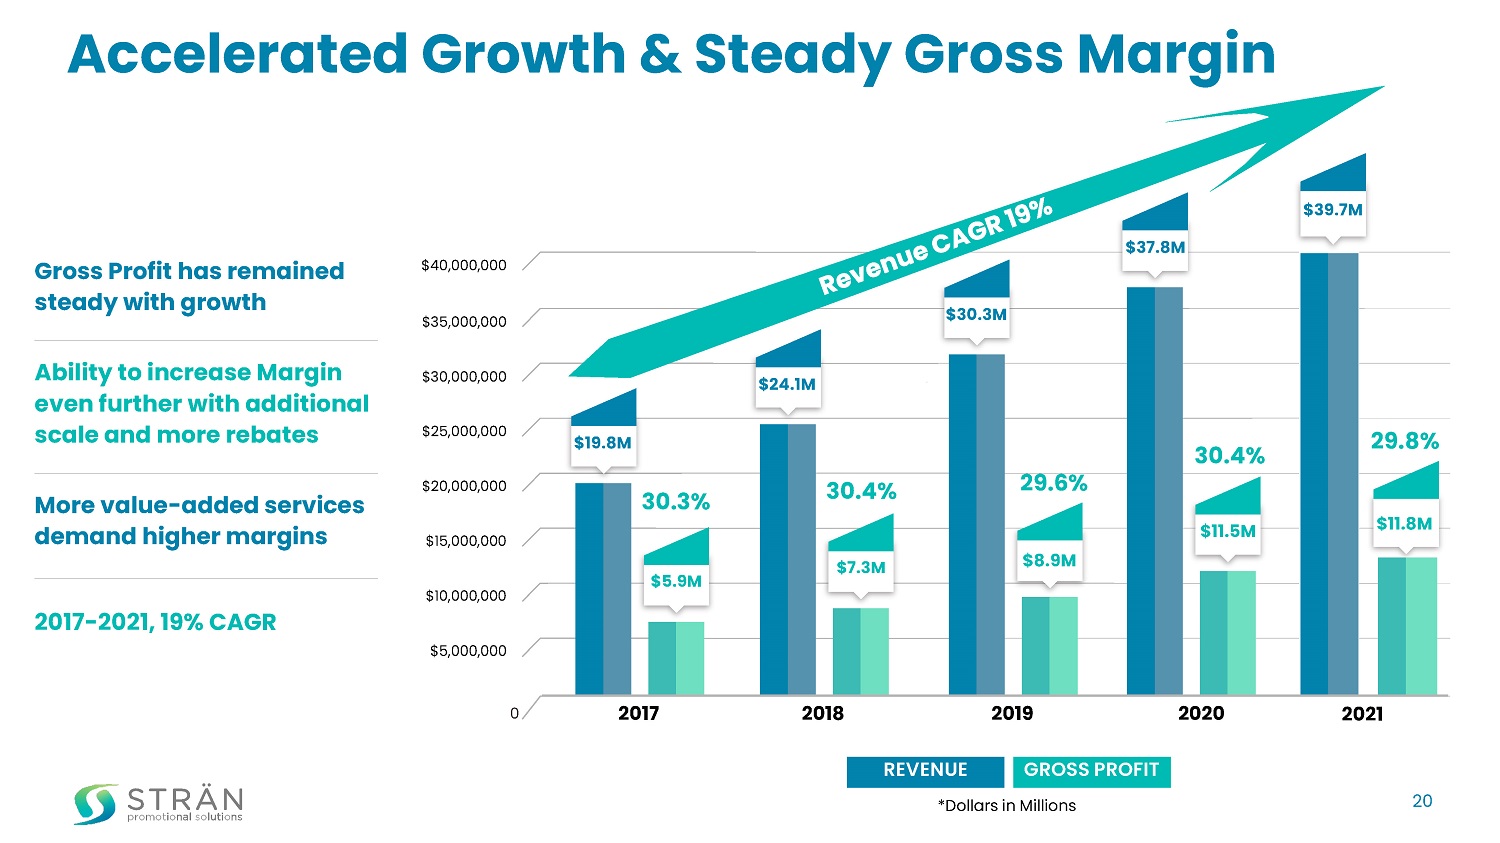
Accelerated Growth & Steady Gross Margin Gross Profit has remained steady with growth Ability to increase Margin even further with additional scale and more rebates More value - added services demand higher margins 2017 - 202 1 , 19 % CAGR REVENUE GROSS PROFIT *Dollars in Millions 20 0 $35,000,000 $40,000,000 $30,000,000 $25,000,000 $20,000,000 $15,000,000 $10,000,000 $5,000,000 2017 2018 2019 2020 $5.9M $19.8M $7.3M $24.1M $30.3M $11. 5 M $37. 8 M 30.3% 30.4% 29.6% 30.4% 202 1 $11. 8 M $3 9 .7M 29.8 % $8.9M
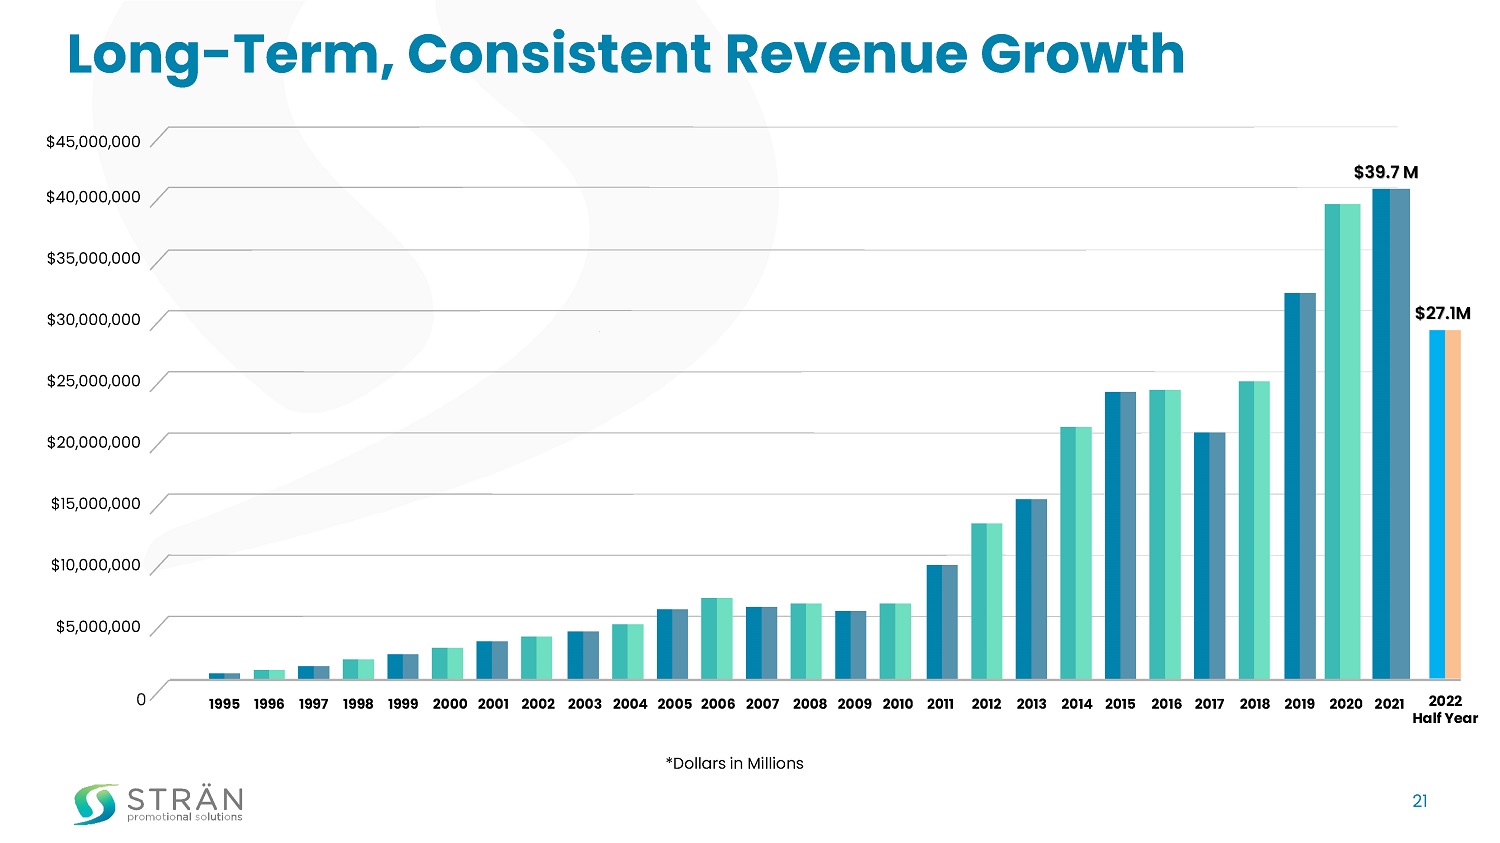
Long - Term, Consistent Revenue Growth 0 $45,000,000 21 $40,000,000 $35,000,000 $ 30,000,000 $25,000,000 $20,000,000 $15,000,000 $ 10,000,000 $5,000,000 1995 1996 1997 1998 1999 2000 2001 2002 2003 2004 2005 2006 2007 2008 2009 2010 2011 2012 2013 2014 2015 2016 2017 2018 2019 2020 2021 $3 9 .7 M *Dollars in Millions 2022 Half Year $ 27.1 M

Investment Highlights 22 Established business since 1994 202 1 a nnual revenue exceeding $3 9 million Large acquisition opportunity set within highly fragmented industry Consistent organic growth over the past 27 years Seasoned owner - led management team Compelling financial profile: Market leader with strong track record and reputation Operating within a $2 3 billion growth industry Strong balance sheet, with no debt and $28+ million in cash First half 202 2 revenue exceeding $ 27 million
Stran Promotional Solutions 2 Heritage Drive, Suite 600. Quincy, MA 02171 www.stran.com
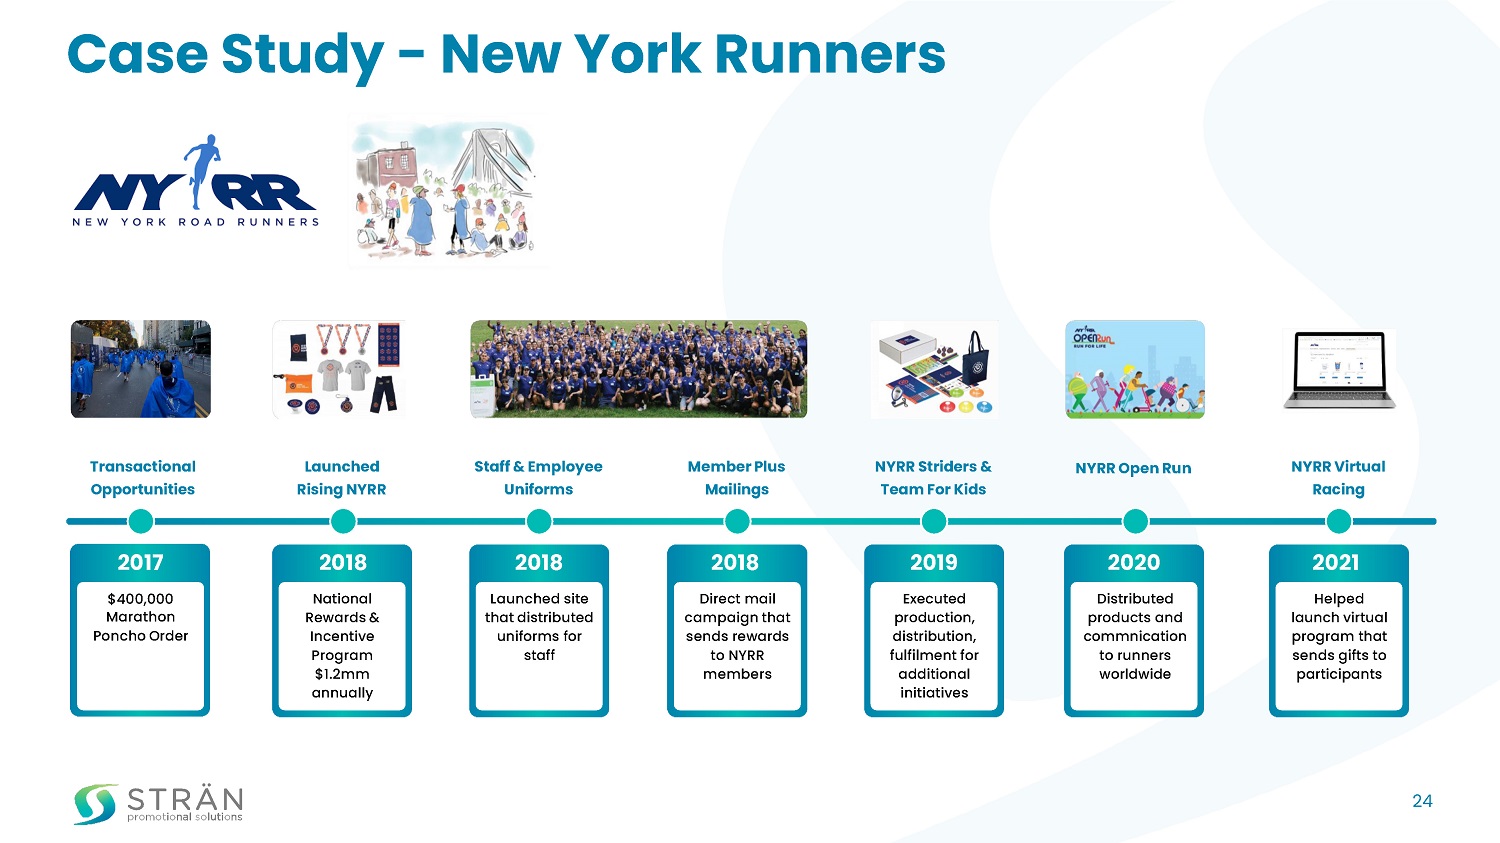
Case Study - New York Runners Transactional Opportunities Launched Rising NYRR Staff & Employee Uniforms Member Plus Mailings NYRR Striders & Team For Kids NYRR Virtual Racing NYRR Open Run 2017 $400,000 Marathon Poncho Order 2018 National Rewards & Incentive Program $1.2mm annually 2018 Launched site that distributed uniforms for staff 2018 Direct mail campaign that sends rewards to NYRR members 2019 Executed production, distribution, fulfilment for additional initiatives 2020 Distributed products and commnication to runners worldwide 2021 Helped launch virtual program that sends gifts to participants 24
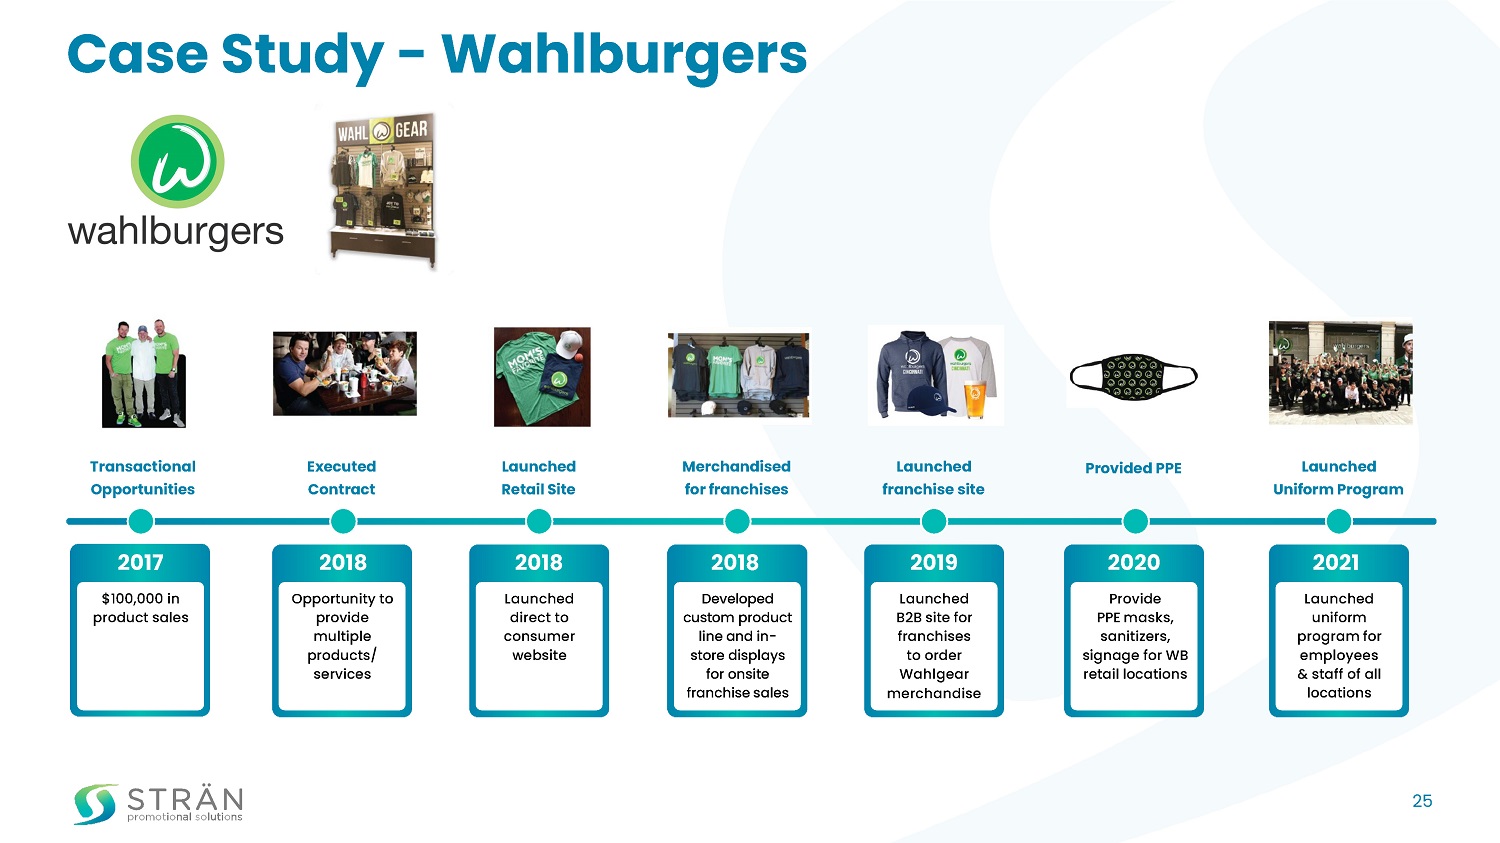
Case Study - Wahlburgers Transactional Opportunities Executed Contract Launched Retail Site Merchandised for franchises Launched franchise site Launched Uniform Program Provided PPE 2017 $100,000 in product sales 2018 Opportunity to provide multiple products/ services 2018 Launched direct to consumer website 2018 Developed custom product line and in - store displays for onsite franchise sales 2019 Launched B2B site for franchises to order Wahlgear merchandise 2020 Provide PPE masks, sanitizers, signage for WB retail locations 2021 Launched uniform program for employees & staff of all locations 25
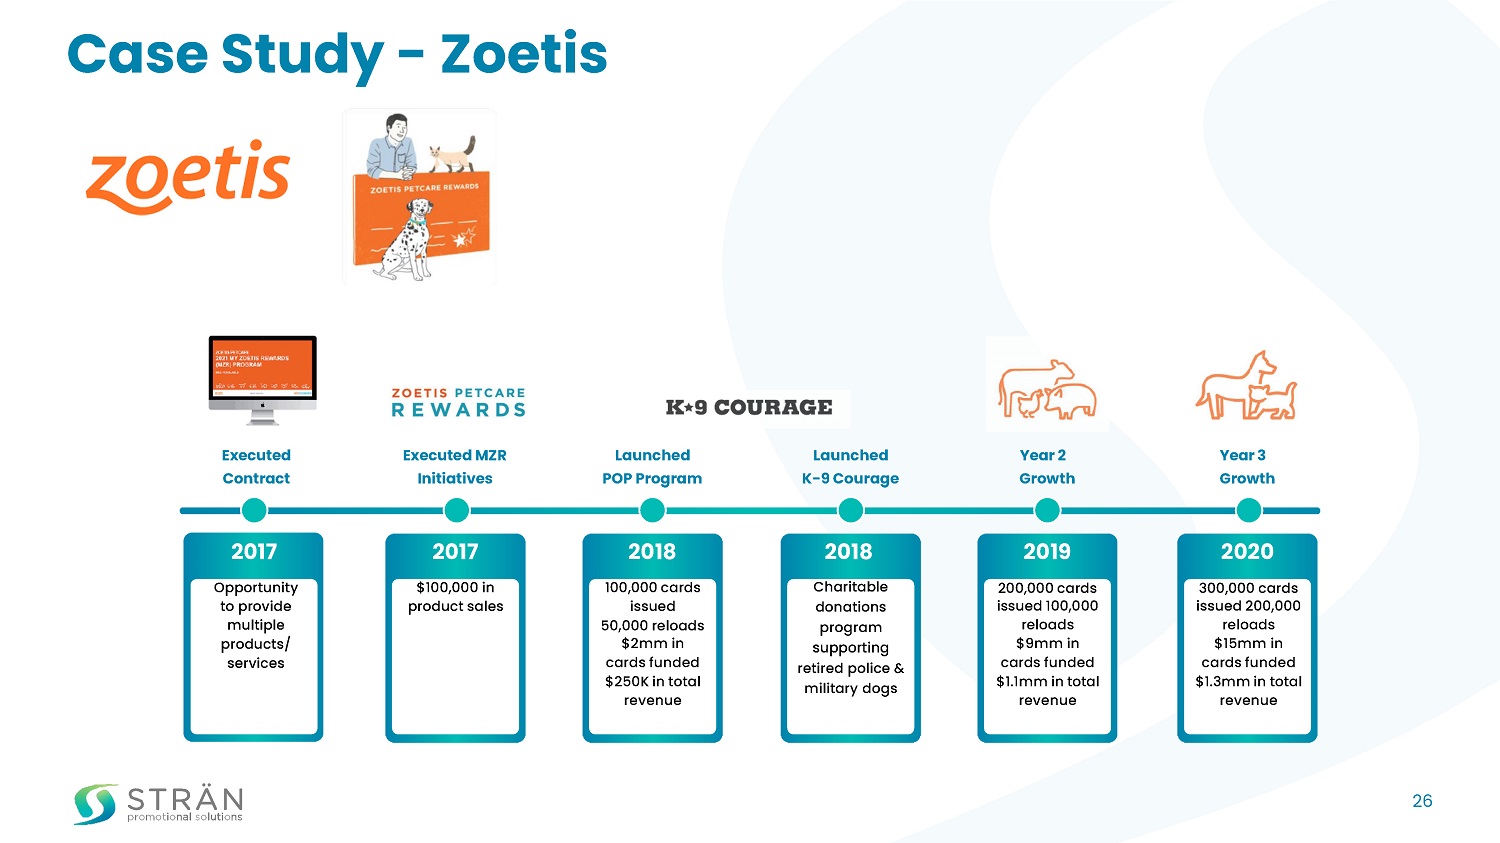
Case Study - Zoetis Executed Contract Executed MZR Initiatives Launched POP Program Launched K - 9 Courage Year 2 Growth Year 3 Growth 2017 Opportunity to provide multiple products/ services 2017 $100,000 in product sales 2018 100,000 cards issued 50,000 reloads $2mm in cards funded $250K in total revenue 2018 Charitable donations program supporting retired police & military dogs 2019 200,000 cards issued 100,000 reloads $9mm in cards funded $1.1mm in total revenue 2020 300,000 cards issued 200,000 reloads $15mm in cards funded $1.3mm in total revenue 26

Appendix
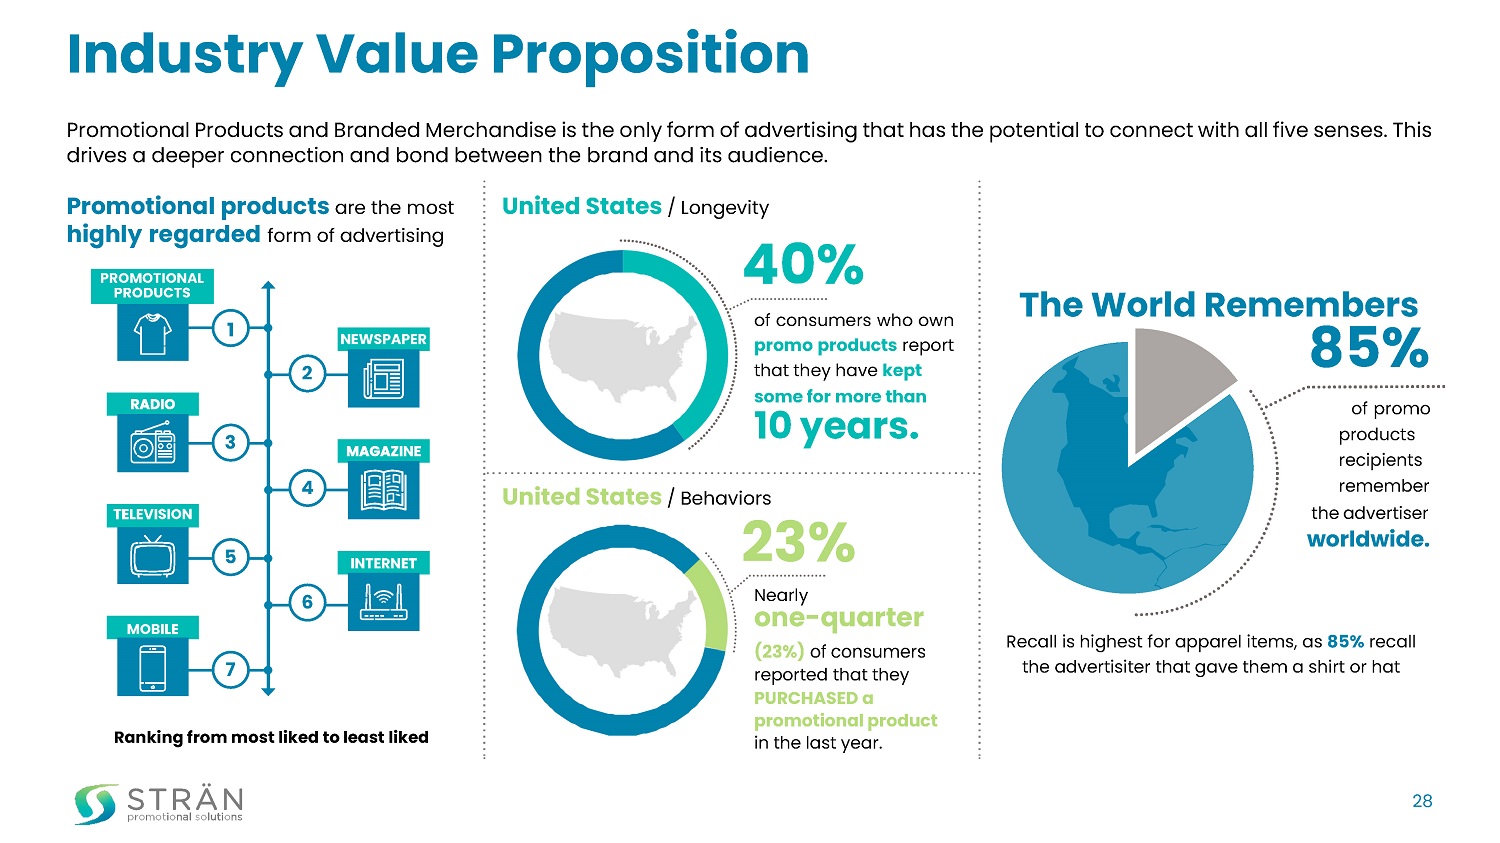
Industry Value Proposition Promotional Products and Branded Merchandise is the only form of advertising that has the potential to connect with all five senses. This drives a deeper connection and bond between the brand and its audience. PROMOTIONAL PRODUCTS Ranking from most liked to least liked 1 3 5 7 2 4 6 Promotional products are the most United States / Longevity highly regarded form of advertising United States / Behaviors 40% 23% of consumers who own promo products report that they have kept some for more than 10 years. Nearly one - quarter (23%) of consumers reported that they PURCHASED a promotional product in the last year. The World Remembers 85% of promo products recipients remember the advertiser worldwide. Recall is highest for apparel items, as 85% recall the advertisiter that gave them a shirt or hat 28
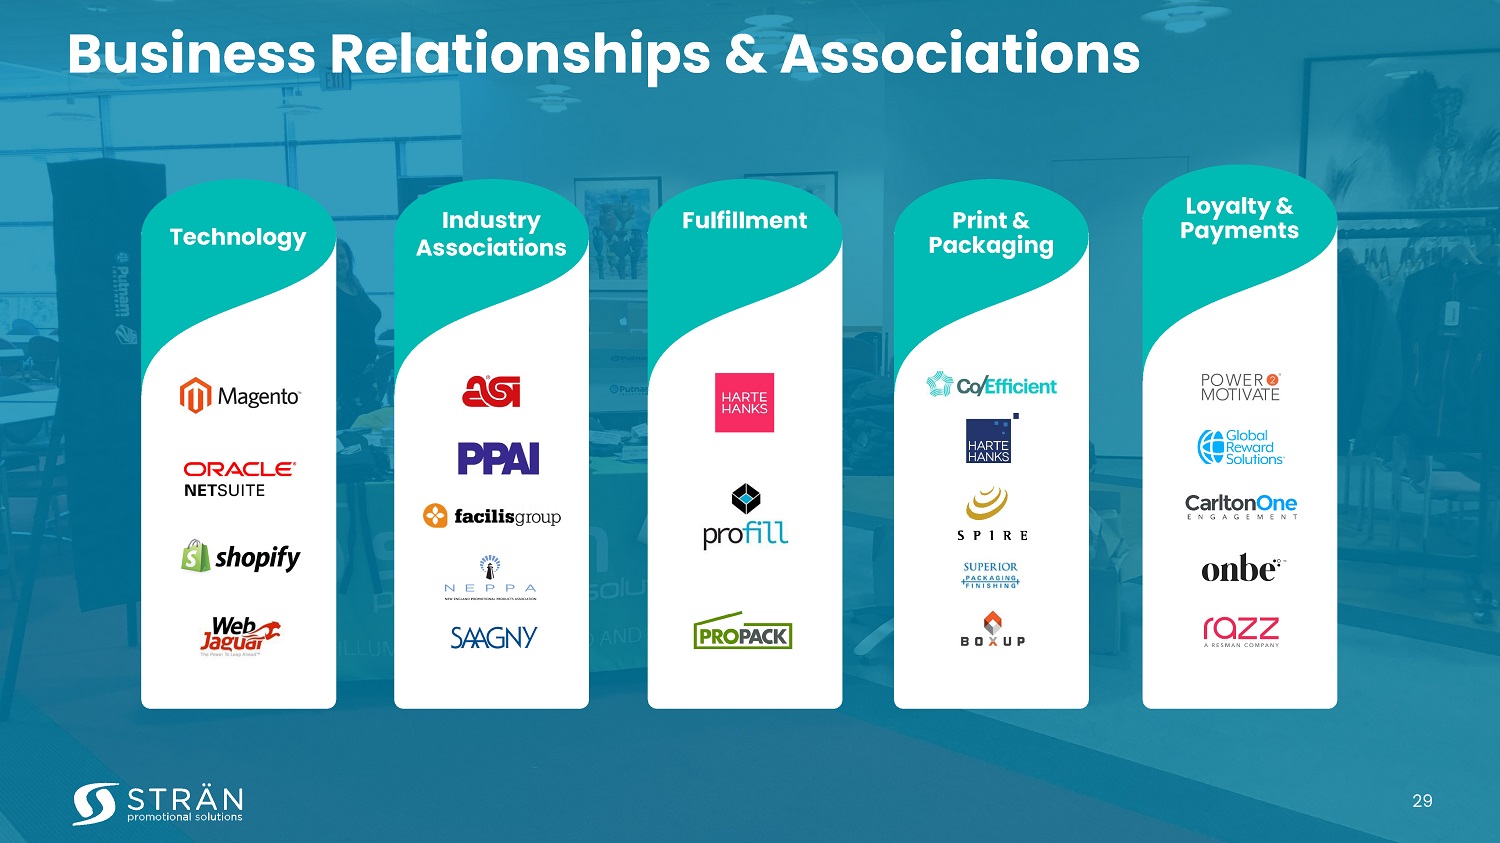
Business Relationships & Associations Technology Industry Associations Fulfillment Print & Packaging Loyalty & Payments 29
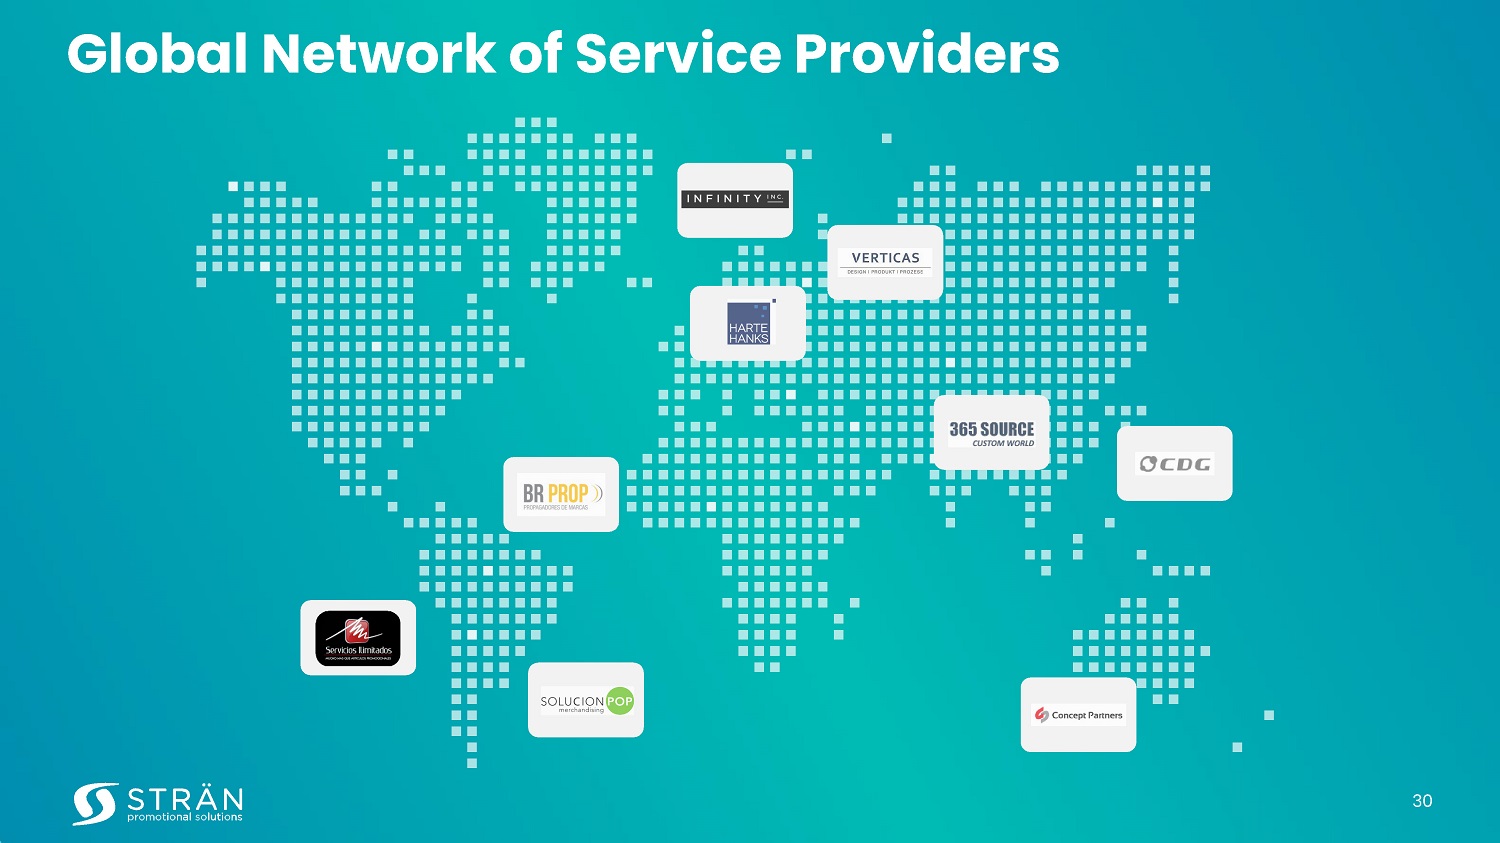
Global Network of Service Providers 30
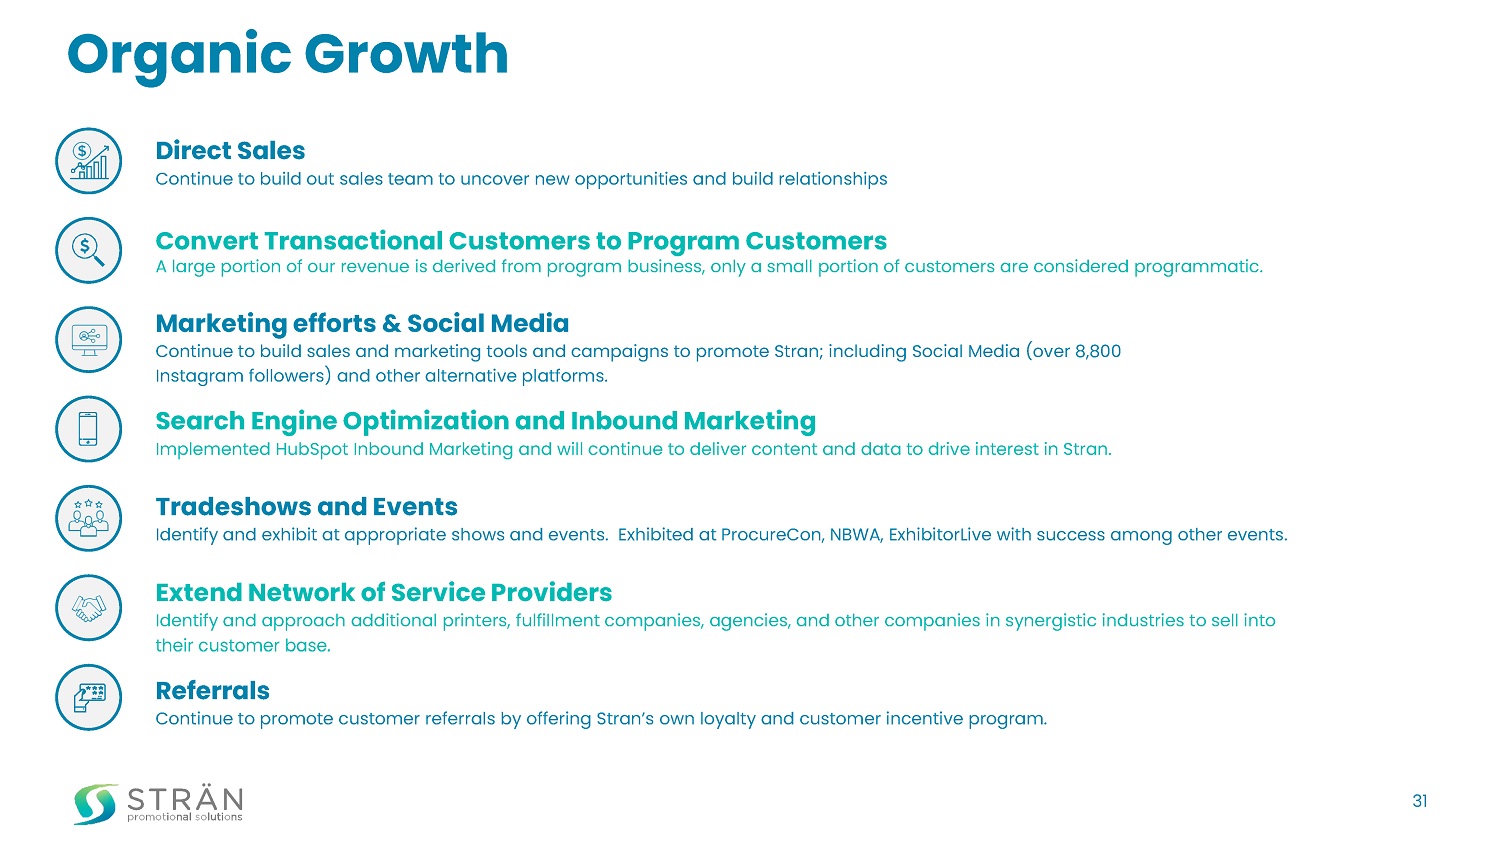
Organic Growth Direct Sales Continue to build out sales team to uncover new opportunities and build relationships Convert Transactional Customers to Program Customers A large portion of our revenue is derived from program business, only a small portion of customers are considered programmatic. Marketing efforts & Social Media Continue to build sales and marketing tools and campaigns to promote Stran; including Social Media (over 8,800 Instagram followers) and other alternative platforms. Search Engine Optimization and Inbound Marketing Implemented HubSpot Inbound Marketing and will continue to deliver content and data to drive interest in Stran. Tradeshows and Events Identify and exhibit at appropriate shows and events. Exhibited at ProcureCon, NBWA, ExhibitorLive with success among other events. Extend Network of Service Providers Identify and approach additional printers, fulfillment companies, agencies, and other companies in synergistic industries to sell into their customer base. Referrals Continue to promote customer referrals by offering Stran’s own loyalty and customer incentive program. 31
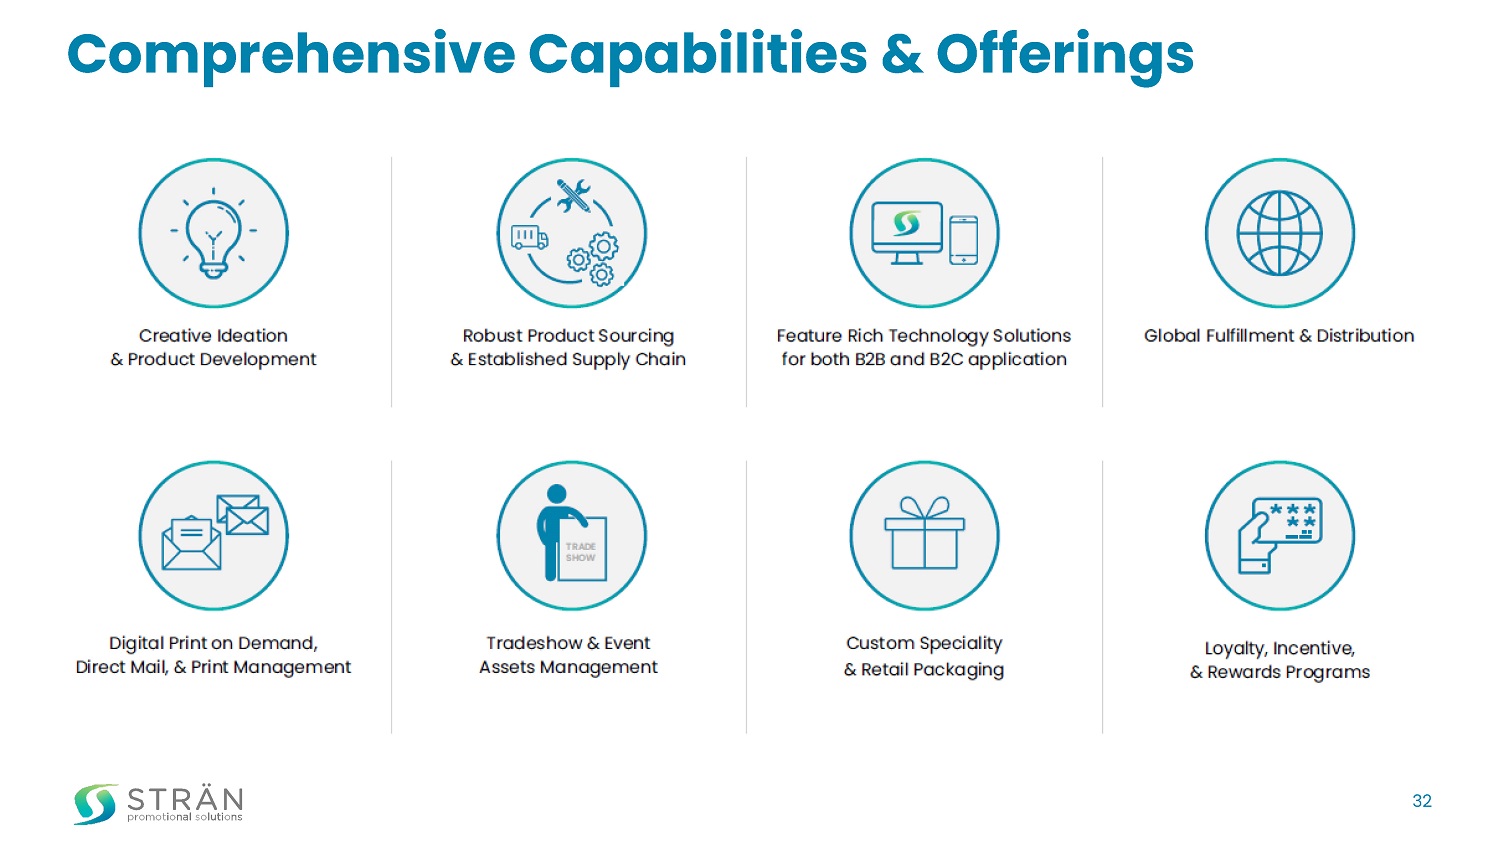
Comprehensive Capabilities & Offerings Creative Ideation & Product Development Digital Print on Demand, Direct Mail, & Print Management Tradeshow & Event Assets Management Feature Rich Technology Solutions for both B2B and B2C application Global Fulfillment & Distribution Loyalty, Incentive, & Rewards Programs Custom Speciality & Retail Packaging Robust Product Sourcing & Established Supply Chain TRADE SHOW 32